A note on this guide
This data in this guide represents a time where travel was affected by COVID.
This guide won't be maintained over time.


This data in this guide represents a time where travel was affected by COVID.
This guide won't be maintained over time.
If you've booked a holiday since Australia's borders opened up, you've probably been shocked by the cost of a holiday compared to pre-COVID prices.
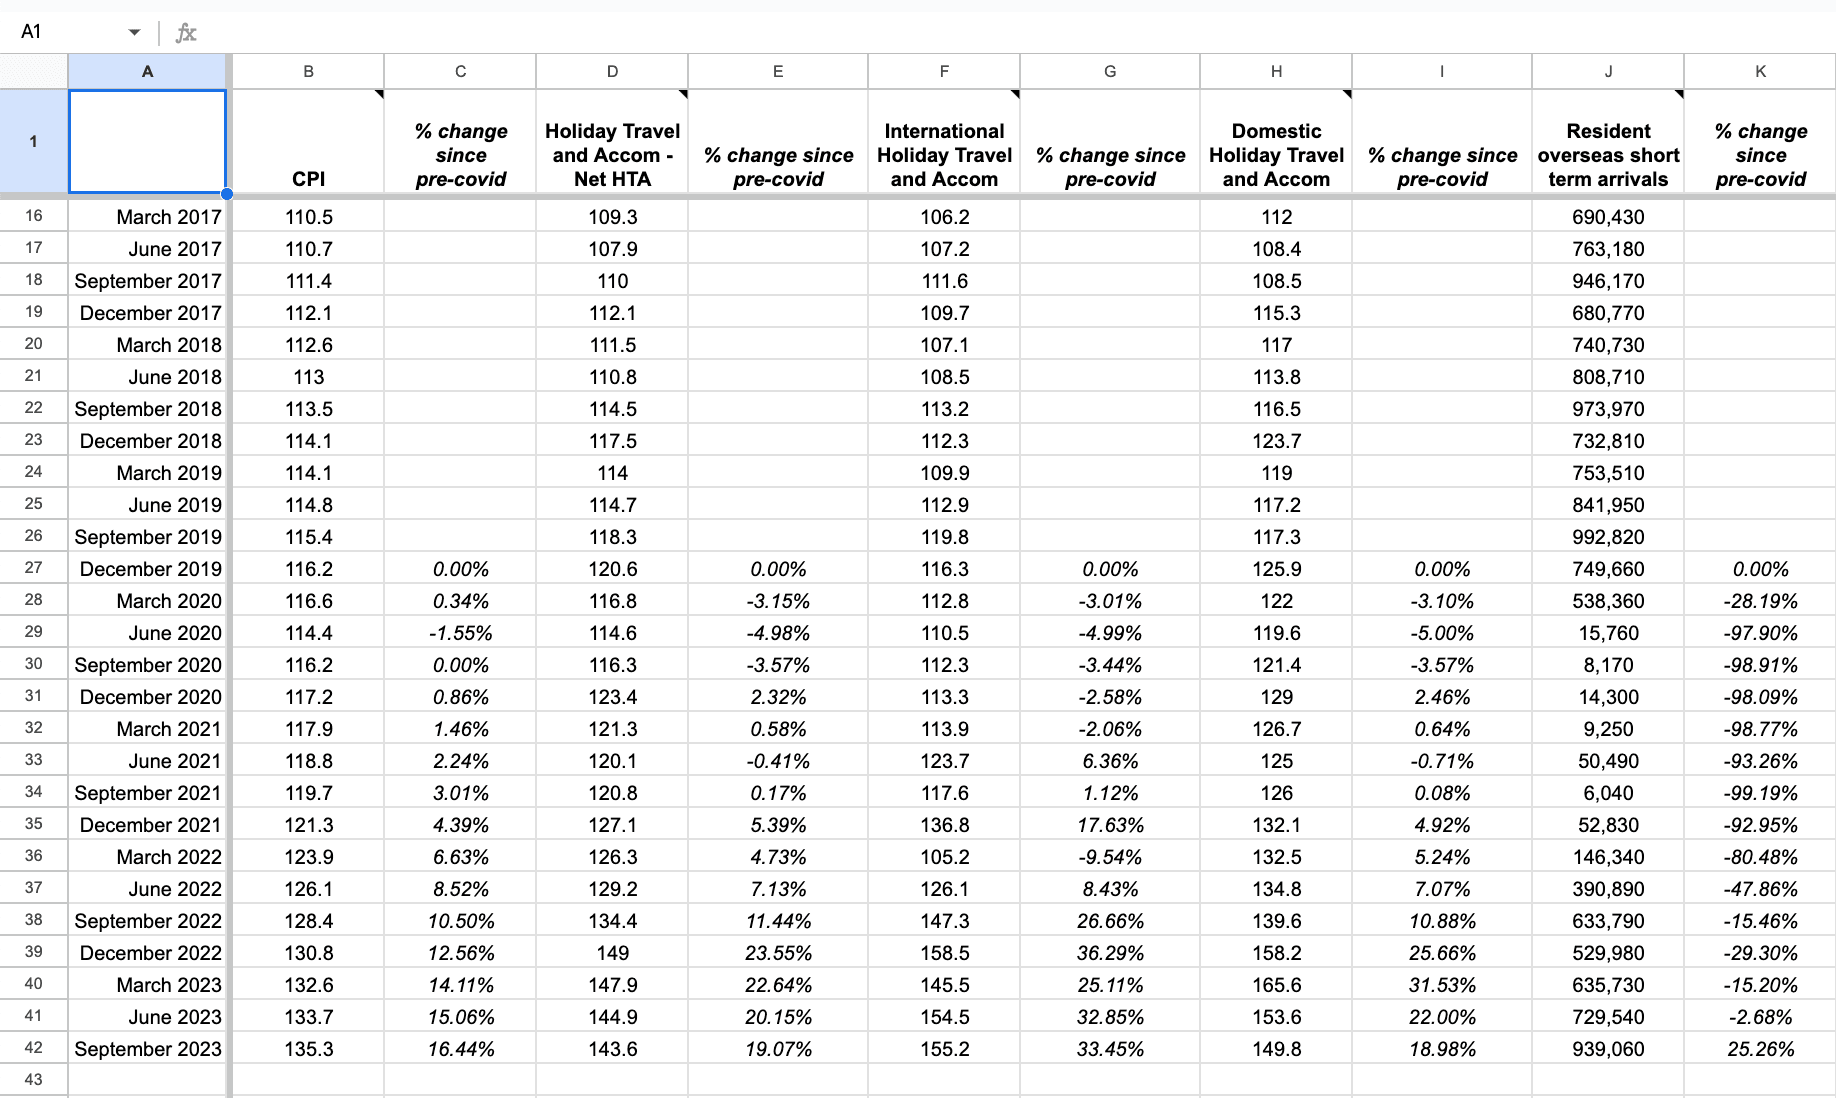
The cost of travel has increased significantly since the pandemic. According to our analysis of ABS data, an international trip costs 33.45% more than it did pre-COVID – that's 17 percentage points more than the Consumer Price Index (CPI).
There's some good news though, at least if you're staying within Australian shores. In the September 2023 quarter, domestic trips were down 2.47% versus the previous quarter, according to the latest Consumer Price Index data.
Domestic travel costs are one of the few goods and services that have not increased. Overall, consumer prices rose 1.2% this quarter.
| Dates | Change in domestic travel costs |
|---|---|
| September quarter 2023 vs June quarter 2023 | -2.47% |
| September quarter 2023 vs September quarter 2022 | 7.31% |
| September quarter 2023 vs December quarter 2019 | 18.98% |
However, domestic trips are still 7.31% more expensive now than the same time last year and 18.98% more compared to the December 2019 quarter.
So how much more might a trip actually cost you? For a $1,500 trip – which is a pretty standard amount for a 7-day trip in 2019 – you're looking at a $284.70 increase.
Overseas trips are another story, with costs still increasing across the board. Prices are up 0.45% since the last quarter and 5.36% since September 2022.
Since December 2019, prices have increased by 33.45%.
According to Finder research, Australians spend an average of $6,765 on international trips. Taking this figure, inflation increases account for $1,696 of the total average cost of a trip.
| Dates | Change in international travel costs |
|---|---|
| September quarter 2023 vs June quarter 2023 | 0.45% |
| September quarter 2023 vs September quarter 2022 | 5.36% |
| September quarter 2023 vs December quarter 2019 | 33.45% |
We've also analysed the differences in costs between the CPI and the cost of travel.
While prices are down slightly since the last quarter, the overall story is different – travel costs have surged above the average rate of inflation.
| Dates | Change in cost price index (CPI) | Change in travel costs (combined) |
|---|---|---|
| September quarter 2023 vs June quarter 2023 | 1.20% | -0.90% |
| September quarter 2023 vs September quarter 2022 | 5.37% | 6.85% |
| September quarter 2023 vs December quarter 2019 | 16.44% | >19.07% |
Australians may be cutting back on some essentials. But not on travel.
Demand is expected to exceed pre-pandemic levels by the end of 2024, according to government forecasts. However, short-term arrivals already exceeded pre-COVID levels for the first time since December 2019 in September this year.
Meanwhile, short-term departures are 18.55% below pre-COVID levels and domestic aviation traffic is now only 5.17% below pre-COVID levels.
According to Finder's Consumer Sentiment Tracker in November 2023, 54% of Australians intend to travel in the next 12 months, similar to pre-pandemic levels (58%, November 2019).
25% of Australians say they plan to go on holiday within Australia in 2024. 15% say they'll head overseas and 14% of the 1,000 plus people surveyed say they plan to do both.
The most popular overseas destinations are Indonesia, the US and the UK, according to over 446,700 quotes from our travel insurance engine, taken across 2023.
Indonesia has knocked the US off top spot since the pandemic, which may be partly due to the falling Australian dollar against the US dollar.
| 2023 January–November | 2022 January–December | 2019 January–December |
|---|---|---|
| 1. Indonesia (including Bali) | 1. Indonesia (including Bali) | 1. USA |
| 2. USA | 2. USA | 2. Indonesia (including Bali) |
| 3. UK | 3. UK | 3. UK |
| 4. Italy | 4. Thailand | 4. Thailand |
| 5. Thailand | 5. France | 5. New Zealand |
| 6. France | 6. New Zealand | 6. Japan |
| 7. New Zealand | 7. Italy | 7. France |
| 8. Japan | 8. Singapore | 8. Singapore |
| 9. Singapore | 9. Fiji | 9. Canada |
| 10. Vietnam | 10. Germany | 10. Italy |
Comparing flights and hotels, travelling during the off-season, going to less popular destinations – these are all well-known ways to cut costs. Here are a less obvious ways you can cut costs:

"Always try to get at least $20 of value from every 1,000 points used," Finder's travel expert Angus Kidman says. Social media groups like Points Finder and our frequent flyer guide can help you get more for your money.

If you have a credit card, it may come with complimentary travel insurance. Many fall below the standard of most travel insurance policies and won't cover pre-existing conditions, though some, such as Bankwest's Zero Platinum Mastercard, let you upgrade benefits and can be good value for money.

Scout out the cheap places to eat and public transport routes before you head off. I find it much easier to save when I have a plan and when I'm not wandering around a foreign city dehydrated and on an empty stomach.

Many major cities have more than one airport. The ones further from the city centre are often cheaper. Just make sure it has cheap public transport options to get you to your accommodation.

Australians spend an average of $311 on car hires. If you're renting a car (hint: if public transport is available, it's usually much cheaper) don't settle for the main one at the airport. There are often cheaper options elsewhere.
Finder conducted an analysis of the quarterly ABS Consumer Price Index data released by the Australian government, which was most recently updated in October 2023. It measures the price of items including travel, groceries, fuel and cars. We looked specifically at hotel, travel and accommodation costs for domestic and international trips.
Keep in mind, this data is based on September 2023 information, even though it is released in October 2023, so prices you actually see may have changed since this data was collected.
We also analysed ABS Overseas Arrivals and Departures and aviation activity, as well as quotes received through Finder’s travel insurance engine, to assess the demand for travel over the last 9 years.

With 3 levels of cover and multiple optional extras available, you can make your travel insurance policy cover as much or as little as you’d like.
The best travel insurance policies are different for each individual traveller.
Part of a new wave of travel insurers, Freely offers more flexibility than most. Love holding stuff on your phone? This could be for you.
Check out these travel insurance coupons to save on your policy.
Our verdict: AllClear Travel Insurance covers globetrotters of any age and more than 1,300 pre-existing medical conditions, including heart complications and diabetes.
Compare Air New Zealand Travel Insurance, see features, and more.
If you’re planning to travel to a country that has high travel risks, learn how cover is and is not provided.
CBA Travel Insurance offers budget-friendly cover for younger travellers. Learn more.
If you need a policy that covers the risk of medical expenses when you travel outside of Australia, then it is pivotal that you look beyond your Medicare cover. Compare the medical coverage of travel insurance policies online.
Planning a holiday is a lot of work. Webjet Travel Insurance makes the job easy with its range of policies, including comprehensive.
