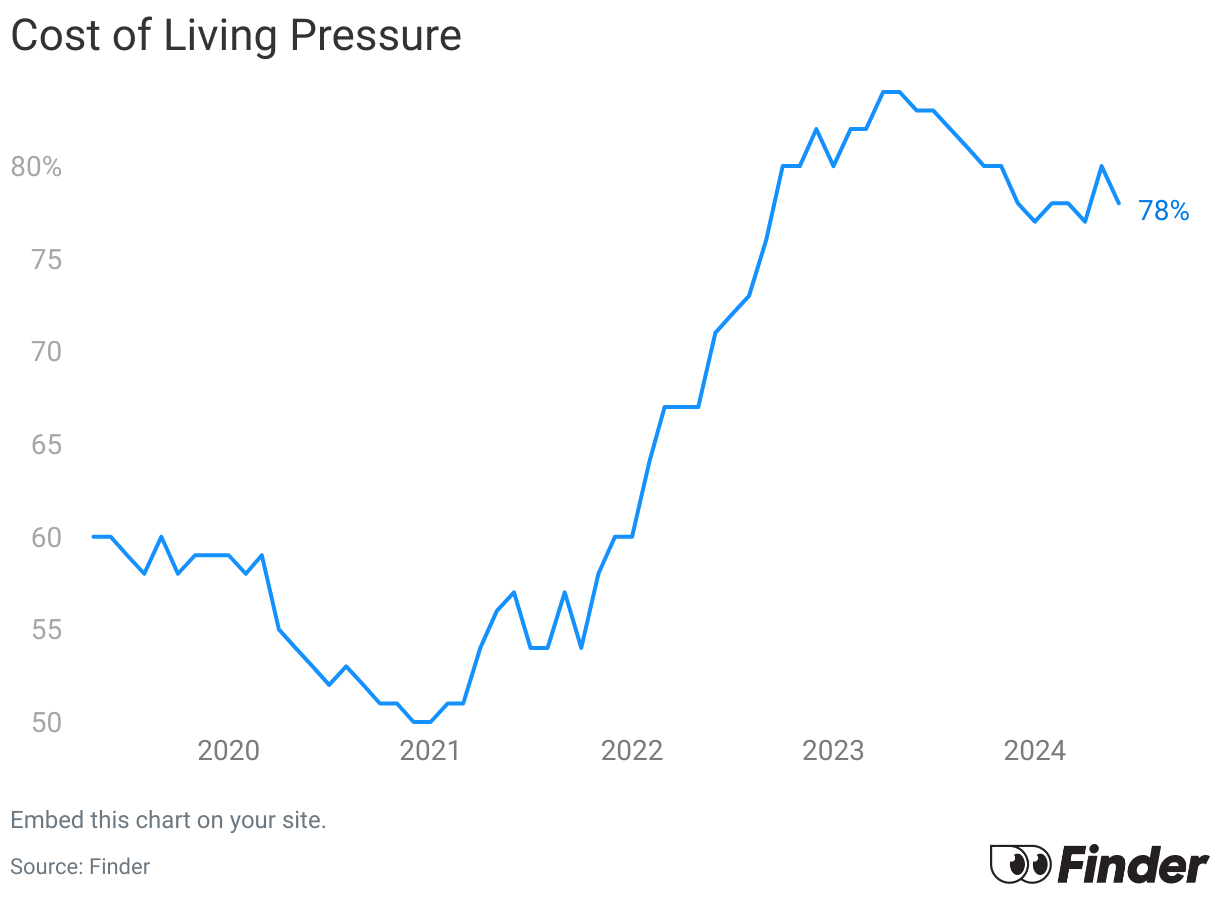
The Cost of Living Pressure Gauge, devised by Finder, measures the financial burden on Australian households. It integrates findings from Finder's Consumer Sentiment Tracker with official government data, providing a clear depiction of the economic challenges faced by consumers. Updated monthly, the model combines monthly and quarterly data on various aspects such as housing stress, salary projections, household debt, financial strain, savings, holiday intentions, credit card expenditure, the RBA cash rate target, property values and inflation. Presently, the Cost of Living Pressure Gauge stands in the extreme range, at 80%.
So what exactly does this look like in raw terms?
At an extreme pressure level of 80% at the end of July 2026:
Mortgage stress affects 61% of mortgage holders, up from 60% last month. Meanwhile, 58% of renters are experiencing rent stress, unchanged from last month.
The proportion of homeowners struggling with mortgage payments remained unchanged at 38% from last month. Meanwhile, 47% of renters are still struggling to pay rent, also unchanged from last month.
On average, Australians have $43,462 in cash savings, up from last month's $40,885.
75% of Australians feel extremely or somewhat stressed about their finances.
The RBA's cash rate target is 4.35% as of August 2026
Annual inflation increased by 3.8% in June 2026
Australian credit card spending was $40.0 billion in June 2026
48.5% of the total credit card balances were accumulating interest.
Almost one in three (28%) Aussies are saying they can't handle their finances without a credit card.
Comparatively, at an extreme pressure level of 83% in July 2023:
Mortgage stress affected 62% of mortgage holders, while 58% of renters were stressed about their rent.
Only 40% of homeowners had difficulty paying their mortgages, while 49% of renters struggled to pay their rent.
On average, Australians had $31,324 in cash savings in July 2023.
82% of Australians said they were stressed about their current financial situation.
The cash rate target was lower at 4.10%.
In July 2023, the total Australian credit card spending was $34.34 billion.
47.8% of the total credit card balances were accumulating interest.
28% of Australians were saying they can't manage their finances without a credit card.
The July 2026 reading points to renewed pressure, edging closer to the April 2023 peak of 84%. This reflects persistent inflation and a higher cash rate, both of which continue to squeeze household budgets. The drivers of financial stress have also shifted. Earlier easing was largely driven by stronger household savings and lower housing stress. However, the latest Consumer Sentiment Tracker shows rent stress rising again. This trend is also reflected in Reserve Bank of Australia credit data, which shows an increase in credit card balances accruing interest over the same period. Nevertheless, pressure remains significantly higher than the levels recorded through most of 2020 and 2021. More information on the methodology behind these figures is provided below.
Methodology
Finder's Cost of Living Pressure Gauge merges data from its Consumer Sentiment Tracker (CST) and the Reserve Bank of Australia (RBA). Updated monthly, it combines CST data with RBA figures, which are updated either monthly or quarterly. When specific monthly RBA data is unavailable, the preceding quarter's figures are used.
Percentage data in the gauge has a set maximum, or "ceiling", defined as 100% pressure. For example, if a survey question like "How stressed are you about your financial situation?" has an 80% ceiling, then 80% of negative responses (extremely or somewhat stressed) equates to 100% pressure. Responses exceeding this ceiling are capped at 100%. This weighting is applied proportionally. Non-CST data is converted to a percentage as described below in "Data categories explained". After calculating all data, a global weighting is assigned to each figure, as outlined in the table below. Historical pressure figures may be revised if new historical data is released.
Data categories explained
Mortgage/rent stress: Percentage of consumers who identify their mortgage or rent payments as a primary financial stressor.
Mortgage/rent struggle: Percentage of consumers who find it difficult to make their rent or mortgage payments.
Salary sentiment: Percentage of Australians expecting a pay rise within the next year.
Spend sentiment: Percentage of Australians unhappy with the amount they need to spend monthly to maintain their standard of living.
Household debt sentiment: Percentage of Australians who have negative feelings about the level of household debt.
Financial stress: Percentage of Australians who report feeling extremely or somewhat stressed about their finances.
Credit card dependency: Percentage of respondents relying on credit cards to manage their finances.
Holiday plans: Percentage of Australians intending to go on a holiday in the upcoming year.
Savings index: Average monthly savings as a percentage of $1,000 of income.
Total savings index: Average total savings as a percentage of $50,000.
Cash rate index: Current cash rate relative to a 5% benchmark.
Savings rate index: Current average savings account interest rate relative to a 5% benchmark.
Credit card spend index: Total credit card spending as a percentage of a $35 billion benchmark.
Graham Cooke is Finder’s Head of Consumer Research, overseeing data analysis on consumer spending and saving habits. He is a passionate advocate for financial literacy and consumer rights, regularly appearing on major TV networks like ABC News and 7 News, and contributing to top outlets like Yahoo Finance and Money Magazine. Graham holds a Bachelor of Science (Hons) in Physics, as well as Tier 1 and Tier 2 certifications (RG 146) that comply with ASIC standards.
See full bio
Graham's expertise
Graham
has written
57
Finder guides across topics including:
Home loans and the housing market
Credit cards & personal finance
Finder Awards
Retail economics & FMCG
Travel
Finder's RBA Cash Rate Survey, Consumer Sentiment Tracker, Cost of Living Pressure Gauge and Property Investment Index
Can AI effectively manage risk and deliver returns in real-world markets? To answer this question, we have deployed seven of the most advanced AI platforms — ChatGPT, Gemini, Copilot, DeepSeek, Perplexity, Meta AI and Grok — to act as portfolio managers.
Finder's Property Investment Index predicts price growth in each suburb across Australia's major cities. Find out how your suburb stacks up.
Important information about this website
Finder is a comparison service. We do not compare every product or every provider in the market.
We make money through commercial arrangements with some of the providers on this site. Products marked 'Sponsored', 'Promoted', 'Featured' or 'Advertisement' appear as a result of a commercial arrangement.
Our editorial content, product reviews and any 'Top Pick' designations are prepared independently of these commercial arrangements.
The default order of products in our tables can be influenced by commercial arrangements. You can re-sort or filter using the controls above each table.
Some content on this site may be generated or supported by AI tools. You should verify details directly with the provider.
Finder is one of Australia's leading comparison websites. We are committed to our readers and stand by our editorial principles.
Our comparison service does not include every product or every provider in the market. Some product issuers offer their products under multiple brands or through associated companies. Where we can, we identify the underlying issuer so you can compare like with like, but you should always check with the provider directly to confirm which brand you are dealing with.
Finder is a comparison website and an intermediary. We are not a product issuer and we do not provide personal financial or credit advice. When you click a link to a product, or apply for a product through our site, you deal directly with the product issuer. We may receive a referral fee, commission or other payment from the issuer if you click through, apply or take out a product. We describe these arrangements in more detail under 'How we make money' below.
Product features, fees, terms and eligibility criteria are set by the product issuer and may change. We rely on information supplied by issuers when we present product details on our site. Before you apply for or take out any product, you should confirm the details directly with the issuer.
We earn revenue from Finder in four principal ways:
Referral fees and commissions. When you click a product link, complete an enquiry form or apply for a product through our site, we may receive a referral fee, commission or other payment from the product issuer. We may also receive payment based on the volume of leads or conversions we send to an issuer.
Sponsored placements. Products marked 'Sponsored', 'Promoted', 'Featured' or 'Advertisement' appear as a result of a commercial arrangement between Finder and the issuer. These labels always indicate a paid placement. We do not use them for editorial choices.
Display advertising. Banner advertising, newsletter advertising and similar display ads on our site are paid by advertisers.
Content sponsorship. Some articles, videos and social media posts are sponsored by an issuer and are clearly labelled as such.
Our editorial opinions, product reviews and any 'Top Pick' designations are prepared independently of these commercial arrangements. A 'Top Pick' is an editorial choice made by our writers and editors based on the criteria described on each comparison page. A 'Top Pick' is not a personal recommendation and does not mean the product is appropriate for your circumstances.
If you would like to know whether we have a commercial arrangement with a specific product issuer, please contact us.
When products are grouped in a table or list, the default order can be influenced by commercial arrangements we have with product issuers. In some categories, sponsored or featured products appear in the top positions of the table by default, and are always labelled as such.
Other factors that influence default order include price, fees and features, and (where relevant) our editorial view of the product.
You can re-sort every comparison table using the controls above the table. You can filter by product features that matter to you. The order you see after re-sorting or filtering is not influenced by commercial arrangements.
Some content on this site is generated or supported by artificial intelligence tools, including our AI-powered assistant FinderBot. AI-generated content may contain errors. Please verify important information directly with the product issuer before making a financial decision. For more information about FinderBot, see the FinderBot Terms of Use and FinderBot Privacy Collection Notice.
Please read our website terms of use and privacy policy for more information about our services and our approach to privacy.
We update our data regularly, but information can change between updates. Confirm details with the provider you're interested in before making a decision.
Our goal is to create the best possible product, and your thoughts, ideas and suggestions play a major role in helping us identify opportunities to improve.