Finder makes money from featured partners, but editorial opinions are our own.

State of Origin 2016 team comparison: NSW Blues vs. QLD Maroons

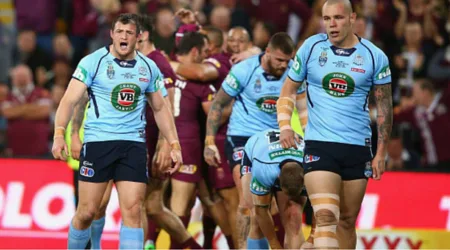
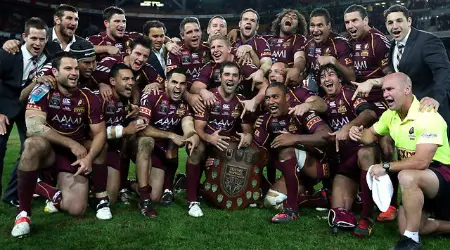
The Ultimate State of Origin lineup comparison.

395398-gorden-tallis

Damaging report into State of Origin eligibility fingers Queensland. Queensland is twice as dependent on non-Queenslanders than NSW.

Since the Super League War

  • Since 1995, on average 27.12% of the QLD team were not born in QLD (QLD has one 61% of the series with a result in this time)
  • Since 1995, on average 6.34% of the NSW team were not born in NSW (NSW has won 39% of the series with a result in this time)
  • NSW has not fielded a player born in QLD since 1995
  • QLD has fielded a NSW player in its team every year since 1991

Individual statistics

  • Brad Thorn is the biggest loser in State of Origin series, winning only 9.09% of his 11 games (data restricted to players of 10 games or more)
  • Ben Kennedy is the biggest winner in State of Origin series, winning 76.92% of his 13 games (data restricted to players of 10 games or more)
  • Greg Inglis has played the most games against his rival state at 24

What's trending right now with State of Origin?

Mate against mate, state against state – or so the claim goes – but is it really true?

066495-1a6cc962-d196-11e3-8fbf-4c17b85df1c4

With every passing year the concept dilutes as eligibility blurs. What are the actual facts? Has one team been bending the truth more than another? We crunched the data and have the answer, it is a definitive 'yes!'

Since the first State of Origin game on July 8, 1980, 179 players have represented Queensland, and 257 have turned out for NSW. Together they have contributed to 102 games across 33 full series and three standalone showcases. Queensland has won 18 of those series, New South Wales 13, and two were drawn. In total, Queensland has won 54 games, NSW 46 and two were drawn.

The series is famous for its equilibrium, with the teams so evenly matched over such a long period that games have literally been decided on one dropped ball, missed tackle or dodgy call - the line is that thin. But how often has the line between victory and failure been torn by players representing a state under false pretences? What is the true impact these players have had on the overall State of Origin legacy, and the results of individual games and series themselves? We found out.

The conclusion

Yes, let’s start at the end. Below you will find all the data and the data shows that Queensland has significantly benefited from the fielding of non-Queenslanders, and in particular New South Welshman, in their teams. Not only has Queensland done it substantially more often and for greater periods of time, but Queensland has shown double the dependency on non-Queensland players for their series victories.

The data also reveals a dramatic increase in the use of non-QLD players by Queensland over the last 20-years. There appears to be a direct correlation between the three series victories in a row for NSW from 1993 to 1995 and the change in percentage of non-QLD players to appear in the QLD team since. The Super League war was no-doubt a key driver of this shift, but it is one that has extended all the way through to today. In fact, since 1995, in 15 of the 20 series more than 25% of the QLD team have not been Queenslanders. In correlation, NSW has only exceeded 10% of their team being non-New South Welshman five times, and never surpassed 14%.

During this period, QLD has won 11 series and NSW 7 while two were drawn. Furthermore, during these 20 years, non-QLD players contributing to the Maroons have been predominantly from NSW. Whereas for NSW, they have been solely from overseas birth. It’s just the start of some very intriguing data – read on for more.

The data

Note: The following data specifically focused on place of birth, the truest indicator of affiliation.

Pasted image at 2015_05_18 03_05 PM

How many QLD players are not true Queenslanders?

Of the 179 Queensland players used in State of Origin, 17 were from NSW, 3 were from another state altogether, and 12 were actually born overseas – the total is 32. Together this reveals that 17.9% of the players to run onto the paddock for the Maroons, are not true Queenslanders. 9.5% of the individuals who played for QLD were actually New South Welshman by birth.

How many NSW players are not true New South Welshman?

Of the 257 NSW players used in State of Origin, 4 were from QLD, 6 were from another state altogether, and 10 were actually born overseas – the total is 20. Together this reveals that 7.8% of the players to run onto the paddock for the cockroaches are not true New South Welshman. 1.6% of the individuals who played for NSW were actually Queenslanders by birth.

Where the players from each state were bornRival stateOther statesOverseasLocal StateTotal
QLD17312147179
NSW4610238258

image

Game contribution

How many games have non-QLD players contributed to QLD?

Between them, the 32 non-QLD players playing for QLD have a combined contribution of 246 games. 166 of these were specifically contributed by players actually born in NSW. 87 of these 166 contributions were in winning games, which is a 9.78% of overall winning contributions by players to the Queensland cause.

How many games have non-NSW players contributed to NSW?

Between them, the 20 non-NSW players playing for NSW have a combined contribution of 130 games. 29 of these were specifically contributed by players actually born in QLD. 13 of these 29 contributions were in winning games, which is a 1.71% of overall winning contributions by players to the NSW cause.

Combined game contribution of playersRival stateOther statesOverseasLocal State
QLD166161141,390
NSW2939621,556

The pure team

Of the 33 full series, only 7 times has QLD fielded a team comprised solely of Queenslanders. All of these occurred between 1983 and 1991. For NSW, it has only fielded an all NSW team six times, and it happened in a row between 1996 and 2001.

Series by series breakdown of who has fielded the most amount of non-state players

In the 33 full series, on nine occasions NSW has had a greater percentage of non-NSW players in its side than QLD has had non-Queenslanders in its side. Thus QLD has had a greater percentage in 24 series. Of the 33 full series, on six times NSW has fielded more QLD players than QLD has fielded NSW players. On four occasions the percentage has been the same. In the other 23 series, QLD has fielded more NSW players than NSW has fielded QLD players.

In fact, NSW has not fielded a player born in QLD since 1995. QLD has not fielded a team without a NSW born player since 1991.

Series victories versus player birth

Of the 18 series that QLD has won, it had the greater percentage of non-State players in its side on 14 of those occasions – revealing a 77.8% dependency. Of the 13 series that NSW has won, on five of those occasions it had the higher percentage of non-State players across the series – revealing a 38.5% dependency.

The number of times a non-Queenslander has contributed to a series for QLD

Of the 32 non-QLD players to have played for QLD that have contributed a combined total of 126 times to a series – a total of 17.62% of all contributions. 70 of these contributions came on behalf of NSW born players – a total of 9.79% of all contributions.

The number of times a non-New South Welshman has contributed to a series for NSW

Of the 20 non-NSW players to have played for NSW that have contributed a combined total of 62 times to a series – a total of 7.91% of all contributions. 14 of these contributions came on behalf of QLD born players – a total of 1.79% of all contributions.

Which points were truly earned?

Points contributed by non-NSW players for New South Wales

Since 1980, 1576 points have been scored for NSW. 12 of these were scored by Queenslanders, 44 from players of other states, and 32 by overseas players. In total 5.6% of NSW points were not scored by New South Welshman. 0.8% scored by Queenslanders.

Points contributed by non-QLD players for Queensland

Since 1980, 1681 points have been scored for NSW. 219 of these were scored by Queenslanders, 12 from players of other states, and 56 by overseas players. In total 5.6% of NSW points were not scored by New South Welshman. In total 17.1% of QLD points were not scored by Queenslanders. 13% scored by New South Welshman.

StateRival stateOther statesOverseasLocal state
QLD21912561,394
NSW1244321,488

image (1)

Back to top

State of Origin Infographic

Top QLD-born players to contribute to NSW

  • Peter Sterling - 13 Games
  • Chris Johns - 10 Games
  • Steve Rogers - 4 Games
  • Ken Nagas - 2 Games
  • Overall Winning % = 44.8%

Top NSW-born players to contribute to QLD

  • Greg Inglis – 24 Games
  • Sam Thaiday – 22 Games
  • Billy Moore – 17 Games
  • Michael Crocker – 13 Games
  • Robbie O'Davis – 12 Games
  • Paul Bowman – 12 Games
  • Julian O'Neill – 10 Games
  • Chris Flannery – 10 Games
  • Wayne Bartrim – 9 Games
  • Matt Gillett – 9 Games
  • Israel Folau – 8 Games
  • Craig Greenhill – 6 Games
  • Mat Rogers – 5 Games
  • Norm Carr – 4 Games
  • John Dowling – 3 Games
  • Gary Smith – 1 Game
  • Scott Sattler – 1 Game
  • Overall Winning % = 52.4%

List of players who never should have played State of Origin because they were born overseas

NSW
  • Benny Elias
  • Mario Fenech
  • Phil Blake
  • Ian Roberts
  • John Hopoate
  • Willie Mason
  • Hazem El Masri
  • James McManus
  • Akuila Uate
  • James Tamou
QLD
  • Chris Phelan
  • Adrian Lam
  • Brad Thorn
  • Craig Smith
  • Tonie Carroll
  • Lote Tuqiri
  • Petero Civoniceva
  • Karmichael Hunt
  • Neville Costigan
  • Antonio Kaufusi
  • Ben Te'o
  • Josh Papalii

List of players who never should have played State of Origin because they were born in another state

NSW
  • Bradley Clyde
  • Timana Tahu
  • Peter Wallace
  • Joel Monaghan
  • Justin Poore
  • Josh Dugan
QLD
  • Tony Hearn
  • Willie Tonga
  • Will Chambers
Back to top

More guides on Finder

Ask an Expert

You are about to post a question on finder.com.au:

  • Do not enter personal information (eg. surname, phone number, bank details) as your question will be made public
  • finder.com.au is a financial comparison and information service, not a bank or product provider
  • We cannot provide you with personal advice or recommendations
  • Your answer might already be waiting – check previous questions below to see if yours has already been asked

Finder only provides general advice and factual information, so consider your own circumstances, or seek advice before you decide to act on our content. By submitting a question, you're accepting our Terms of Use, Disclaimer & Privacy Policy and 6. Finder Group Privacy & Cookies Policy.

This site is protected by reCAPTCHA and the Google Privacy Policy and Terms of Service apply.

15 Responses

    Default Gravatar
    CorziffJune 12, 2017

    Origin means where you’re from not who will pay you more or I like the colour of that guernsey. It’s been tinkered with to allow a good player from out of other states and now countries eligible to play just to boost the quality. Imagine QLD only having their own players playing. Their competition in QLD was crap until they were invited into the ARL..also they were going broke.. ☺

      AvatarFinder
      DeeJune 13, 2017Finder

      Hi Corziff,

      Thanks for your comment.

      Cheers!
      Anndy

    Default Gravatar
    JoelMay 15, 2016

    So its basically NSW vs the world. Queenslanders are cheats! Such a joke

    Default Gravatar
    BobJuly 13, 2015

    What about researching pre state of origin, NSW v QLD.
    NSW wanted to do away with the concept as QLD were not competitive.
    NSW teams were made up of mostly QLD players poached.
    Their lies the drive from QLD in winning.

      AvatarFinder
      ShirleyAugust 3, 2015Finder

      Hi Bob,

      Thanks for your suggestions!

      We’ll be sure to look into new data for State of Origin 2016 to see how they stack up.

      Cheers,
      Shirley

    Default Gravatar
    RyanMay 22, 2015

    Dear oh dear, where to start…. How does the number of wins a team had when it featured non state players correlate to any sort of ‘dependency’? Why are the numbers of non state players represented as %? The fact that NSW change half their players each week has absolutely no relevance. Why summarise based on the number of players picked from interstate rather than the number of times a team has picked a non ‘pure team’? Not to mention the convenient choice of ‘birth’ as the only factor that matters. Billy Moore (Third highest ‘non state’ player you have listed for QLD) was only born in NSW because the hospital was closer to his QLD HOME. If he was born hours earlier in the car suddenly QLD are less ‘dependent’ on non state players? why summarise based on number of players vs Number of series?”

    Default Gravatar
    WayneMay 20, 2015

    Of course the 1995 eligibility was broken by NSW ARL powerbrokers who determined which players could be picked from which competitions and eligibilities. So please make sure that is referenced in your findings and not attributed to Qld :)

    So to bring that further forward, what is the fairest way to determine a player’s “state of origin” ? Surely it isn’t one or even a group of single events that can easily be manipulated (such as the Luke Keary case) ? Surely it’s truer to reflect where a player played the majority of their junior football; or where the player believes their heart lies (such as Greg Inglis who stated he felt more like Qld than NSW even though he could have walked into either side).

      AvatarFinder
      ShirleyMay 21, 2015Finder

      Hi Wayne,

      Thanks for the feedback.

      It’s certainly a tough situation because as soon as you go off anything that’s not black or white like place of birth you enter in the possibility for manipulation. What’s to say at age 18 a player could realise that the next 10 years of origin for Queensland already has a halfback so self-declare for NSW?

      Cheers,
      Shirley

Go to site