Nothing divides Australians both young and old like the "who has it harder for property?" debate. Millennials are quick to blame extortionate house prices and stagnant wage growth. Baby boomers hit back with harrowing tales of 17% interest rates and the rampant consumerism of the young.
It's a sentiment as old as time: the younger generation has it easy and the oldies did it tougher. While this is certainly the case with healthcare, technology and the general standard of living, does it ring true for housing affordability as well? Finder decided to dig through the data and end the debate once and for all.
Using a variety of sources (including ABS, RBA, CoreLogic and Finder data), we created a detailed snapshot of the cost of buying a home in 1985 compared to now.
So, who really has it harder?
Interest rates
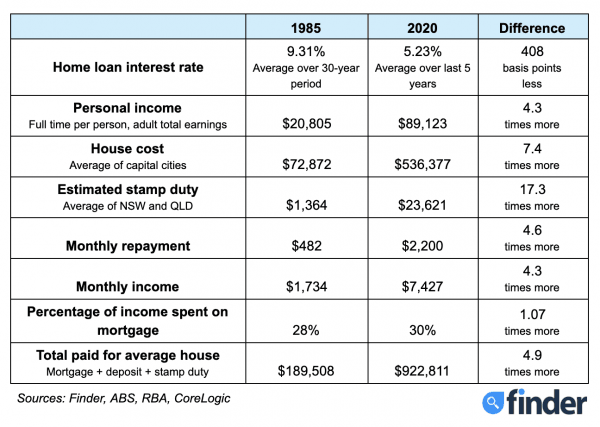
Back in the day, baby boomers forked out huge amounts of interest on their first home. If you bought a house in 1985 and paid it off over 30 years, the average interest rate on a variable home loan was an eye-watering 9.31%1. Fast-forward to 2020 and the average variable rate has dropped to 5.23%2– a difference of 408 basis points. Keep in mind that this is the average advertised rate – many homeowners are actually paying less than this through discounts. With the cash rate also at a historic low of 0.10%, mortgage rates are even dipping below 2.00% for the first time.
But although the older generation paid a higher interest rate on their mortgage, they were also profiting from bigger returns on their savings. The average term deposit interest rate in 1985 was around 12% (read it and weep millennials). These days, term deposits offer a paltry 0.35% on average.
Average home loan interest rate over time
Average home loan interest rate over time
Month
Mortgage Interest Rate
Jan-1985
11.50%
Feb-1985
11.50%
Mar-1985
11.50%
Apr-1985
12.00%
May-1985
12.00%
Jun-1985
12.13%
Jul-1985
12.50%
Aug-1985
12.50%
Sep-1985
12.88%
Oct-1985
13.50%
Nov-1985
13.50%
Dec-1985
13.50%
Jan-1986
13.50%
Feb-1986
13.50%
Mar-1986
13.50%
Apr-1986
15.50%
May-1986
15.50%
Jun-1986
15.50%
Jul-1986
15.50%
Aug-1986
15.50%
Sep-1986
15.50%
Oct-1986
15.50%
Nov-1986
15.50%
Dec-1986
15.50%
Jan-1987
15.50%
Feb-1987
15.50%
Mar-1987
15.50%
Apr-1987
15.50%
May-1987
15.50%
Jun-1987
15.50%
Jul-1987
15.50%
Aug-1987
15.06%
Sep-1987
14.75%
Oct-1987
14.50%
Nov-1987
14.13%
Dec-1987
14.00%
Jan-1988
14.00%
Feb-1988
13.50%
Mar-1988
13.50%
Apr-1988
13.50%
May-1988
13.50%
Jun-1988
13.75%
Jul-1988
14.50%
Aug-1988
14.50%
Sep-1988
14.50%
Oct-1988
14.50%
Nov-1988
14.75%
Dec-1988
14.98%
Jan-1989
14.98%
Feb-1989
15.50%
Mar-1989
16.00%
Apr-1989
16.00%
May-1989
16.00%
Jun-1989
17.00%
Jul-1989
17.00%
Aug-1989
17.00%
Sep-1989
17.00%
Oct-1989
17.00%
Nov-1989
17.00%
Dec-1989
17.00%
Jan-1990
17.00%
Feb-1990
17.00%
Mar-1990
17.00%
Apr-1990
16.69%
May-1990
16.44%
Jun-1990
16.44%
Jul-1990
16.44%
Aug-1990
16.38%
Sep-1990
16.19%
Oct-1990
16.00%
Nov-1990
15.50%
Dec-1990
15.13%
Jan-1991
14.50%
Feb-1991
14.50%
Mar-1991
14.50%
Apr-1991
14.38%
May-1991
13.88%
Jun-1991
13.19%
Jul-1991
13.00%
Aug-1991
13.00%
Sep-1991
13.00%
Oct-1991
12.50%
Nov-1991
12.50%
Dec-1991
12.00%
Jan-1992
11.75%
Feb-1992
11.00%
Mar-1992
11.00%
Apr-1992
11.00%
May-1992
11.00%
Jun-1992
10.38%
Jul-1992
10.30%
Aug-1992
9.98%
Sep-1992
9.92%
Oct-1992
9.92%
Nov-1992
9.92%
Dec-1992
9.92%
Jan-1993
9.92%
Feb-1993
9.92%
Mar-1993
9.92%
Apr-1993
9.72%
May-1993
9.50%
Jun-1993
9.50%
Jul-1993
9.50%
Aug-1993
9.50%
Sep-1993
8.90%
Oct-1993
8.75%
Nov-1993
8.75%
Dec-1993
8.75%
Jan-1994
8.75%
Feb-1994
8.75%
Mar-1994
8.75%
Apr-1994
8.75%
May-1994
8.75%
Jun-1994
8.75%
Jul-1994
8.75%
Aug-1994
8.75%
Sep-1994
9.05%
Oct-1994
9.36%
Nov-1994
9.57%
Dec-1994
9.97%
Jan-1995
10.56%
Feb-1995
10.56%
Mar-1995
10.56%
Apr-1995
10.56%
May-1995
10.56%
Jun-1995
10.49%
Jul-1995
10.49%
Aug-1995
10.49%
Sep-1995
10.49%
Oct-1995
10.49%
Nov-1995
10.48%
Dec-1995
10.48%
Jan-1996
10.48%
Feb-1996
10.48%
Mar-1996
10.48%
Apr-1996
10.48%
May-1996
10.48%
Jun-1996
9.91%
Jul-1996
9.91%
Aug-1996
9.61%
Sep-1996
9.29%
Oct-1996
9.29%
Nov-1996
8.88%
Dec-1996
8.48%
Jan-1997
8.25%
Feb-1997
7.55%
Mar-1997
7.55%
Apr-1997
7.55%
May-1997
7.13%
Jun-1997
7.13%
Jul-1997
7.05%
Aug-1997
6.74%
Sep-1997
6.74%
Oct-1997
6.74%
Nov-1997
6.74%
Dec-1997
6.74%
Jan-1998
6.74%
Feb-1998
6.74%
Mar-1998
6.74%
Apr-1998
6.74%
May-1998
6.74%
Jun-1998
6.74%
Jul-1998
6.74%
Aug-1998
6.74%
Sep-1998
6.74%
Oct-1998
6.74%
Nov-1998
6.74%
Dec-1998
6.52%
Jan-1999
6.52%
Feb-1999
6.52%
Mar-1999
6.52%
Apr-1999
6.52%
May-1999
6.52%
Jun-1999
6.52%
Jul-1999
6.55%
Aug-1999
6.55%
Sep-1999
6.55%
Oct-1999
6.55%
Nov-1999
6.75%
Dec-1999
6.80%
Jan-2000
6.80%
Feb-2000
7.30%
Mar-2000
7.30%
Apr-2000
7.55%
May-2000
7.80%
Jun-2000
7.80%
Jul-2000
7.81%
Aug-2000
8.07%
Sep-2000
8.07%
Oct-2000
8.07%
Nov-2000
8.07%
Dec-2000
8.07%
Jan-2001
8.07%
Feb-2001
7.57%
Mar-2001
7.32%
Apr-2001
6.82%
May-2001
6.82%
Jun-2001
6.82%
Jul-2001
6.82%
Aug-2001
6.82%
Sep-2001
6.57%
Oct-2001
6.32%
Nov-2001
6.32%
Dec-2001
6.07%
Jan-2002
6.07%
Feb-2002
6.07%
Mar-2002
6.07%
Apr-2002
6.07%
May-2002
6.32%
Jun-2002
6.57%
Jul-2002
6.57%
Aug-2002
6.57%
Sep-2002
6.57%
Oct-2002
6.57%
Nov-2002
6.57%
Dec-2002
6.57%
Jan-2003
6.57%
Feb-2003
6.57%
Mar-2003
6.57%
Apr-2003
6.57%
May-2003
6.57%
Jun-2003
6.57%
Jul-2003
6.57%
Aug-2003
6.57%
Sep-2003
6.57%
Oct-2003
6.57%
Nov-2003
6.82%
Dec-2003
7.07%
Jan-2004
7.07%
Feb-2004
7.07%
Mar-2004
7.07%
Apr-2004
7.07%
May-2004
7.07%
Jun-2004
7.07%
Jul-2004
7.07%
Aug-2004
7.07%
Sep-2004
7.07%
Oct-2004
7.07%
Nov-2004
7.07%
Dec-2004
7.07%
Jan-2005
7.07%
Feb-2005
7.07%
Mar-2005
7.32%
Apr-2005
7.32%
May-2005
7.32%
Jun-2005
7.32%
Jul-2005
7.32%
Aug-2005
7.32%
Sep-2005
7.32%
Oct-2005
7.32%
Nov-2005
7.32%
Dec-2005
7.32%
Jan-2006
7.32%
Feb-2006
7.32%
Mar-2006
7.32%
Apr-2006
7.32%
May-2006
7.57%
Jun-2006
7.57%
Jul-2006
7.57%
Aug-2006
7.82%
Sep-2006
7.82%
Oct-2006
7.82%
Nov-2006
8.07%
Dec-2006
8.07%
Jan-2007
8.07%
Feb-2007
8.07%
Mar-2007
8.07%
Apr-2007
8.07%
May-2007
8.07%
Jun-2007
8.07%
Jul-2007
8.07%
Aug-2007
8.32%
Sep-2007
8.32%
Oct-2007
8.32%
Nov-2007
8.57%
Dec-2007
8.57%
Jan-2008
8.72%
Feb-2008
8.99%
Mar-2008
9.34%
Apr-2008
9.44%
May-2008
9.46%
Jun-2008
9.46%
Jul-2008
9.62%
Aug-2008
9.62%
Sep-2008
9.36%
Oct-2008
8.34%
Nov-2008
7.73%
Dec-2008
6.84%
Jan-2009
6.84%
Feb-2009
5.84%
Mar-2009
5.84%
Apr-2009
5.76%
May-2009
5.76%
Jun-2009
5.78%
Jul-2009
5.78%
Aug-2009
5.78%
Sep-2009
5.78%
Oct-2009
6.03%
Nov-2009
6.28%
Dec-2009
6.64%
Jan-2010
6.64%
Feb-2010
6.64%
Mar-2010
6.89%
Apr-2010
7.14%
May-2010
7.39%
Jun-2010
7.39%
Jul-2010
7.39%
Aug-2010
7.39%
Sep-2010
7.39%
Oct-2010
7.39%
Nov-2010
7.79%
Dec-2010
7.79%
Jan-2011
7.79%
Feb-2011
7.79%
Mar-2011
7.79%
Apr-2011
7.79%
May-2011
7.79%
Jun-2011
7.79%
Jul-2011
7.79%
Aug-2011
7.79%
Sep-2011
7.79%
Oct-2011
7.79%
Nov-2011
7.55%
Dec-2011
7.30%
Jan-2012
7.30%
Feb-2012
7.39%
Mar-2012
7.39%
Apr-2012
7.40%
May-2012
7.04%
Jun-2012
6.83%
Jul-2012
6.83%
Aug-2012
6.83%
Sep-2012
6.83%
Oct-2012
6.64%
Nov-2012
6.64%
Dec-2012
6.44%
Jan-2013
6.44%
Feb-2013
6.44%
Mar-2013
6.44%
Apr-2013
6.44%
May-2013
6.18%
Jun-2013
6.18%
Jul-2013
6.18%
Aug-2013
5.93%
Sep-2013
5.93%
Oct-2013
5.93%
Nov-2013
5.93%
Dec-2013
5.93%
Jan-2014
5.93%
Feb-2014
5.93%
Mar-2014
5.93%
Apr-2014
5.93%
May-2014
5.93%
Jun-2014
5.93%
Jul-2014
5.93%
Aug-2014
5.93%
Sep-2014
5.93%
Oct-2014
5.93%
Nov-2014
5.93%
Dec-2014
5.93%
Jan-2015
5.93%
Feb-2015
5.67%
Mar-2015
5.67%
Apr-2015
5.67%
May-2015
5.46%
Jun-2015
5.46%
Jul-2015
5.46%
Aug-2015
5.46%
Sep-2015
5.46%
Oct-2015
5.46%
Nov-2015
5.63%
Dec-2015
5.63%
Jan-2016
5.63%
Feb-2016
5.63%
Mar-2016
5.63%
Apr-2016
5.63%
May-2016
5.39%
Jun-2016
5.39%
Jul-2016
5.39%
Aug-2016
5.26%
Sep-2016
5.26%
Oct-2016
5.26%
Nov-2016
5.26%
Dec-2016
5.26%
Jan-2017
5.26%
Feb-2017
5.26%
Mar-2017
5.28%
Apr-2017
5.28%
May-2017
5.29%
Jun-2017
5.23%
Jul-2017
5.22%
Aug-2017
5.22%
Sep-2017
5.22%
Oct-2017
5.22%
Nov-2017
5.22%
Dec-2017
5.22%
Jan-2018
5.22%
Feb-2018
5.22%
Mar-2018
5.22%
Apr-2018
5.22%
May-2018
5.22%
Jun-2018
5.22%
Jul-2018
5.22%
Aug-2018
5.22%
Sep-2018
5.31%
Oct-2018
5.34%
Nov-2018
5.34%
Dec-2018
5.34%
Jan-2019
5.37%
Feb-2019
5.37%
Mar-2019
5.37%
Apr-2019
5.37%
May-2019
5.37%
Jun-2019
5.15%
Jul-2019
4.94%
Aug-2019
4.94%
Sep-2019
4.94%
Oct-2019
4.80%
Nov-2019
4.80%
Dec-2019
4.80%
Jan-2020
4.80%
Feb-2020
4.80%
Mar-2020
4.52%
Apr-2020
4.52%
May-2020
4.52%
Jun-2020
4.52%
Jul-2020
4.52%
Aug-2020
4.52%
Sep-2020
4.52%
Oct-2020
4.52%
Nov-2020
4.52%
1 Average over a 30-year period
2 Average over the past 5 years
Personal income
Wage growth increased by just 0.1% in the September 2020 quarter, mostly owing to the combination of the COVID-19 pandemic and recession. But millennials are still earning more than their boomer counterparts were. The average annual salary in 1985 was $20,805 – slim pickings when you consider the average annual pay packet is now $89,123. This means millennials are earning 4.3 times more than baby boomers were in 1985.
"But what about the cost of living?" you might ask. Good point – while this has tripled since 1985, the average income has increased by 4.3 times, meaning general living is more affordable than it was in 1985. For example, according to the RBA's inflation calculator, $20,805 in 1985 would be worth around $61,062 today, meaning modern wage-earners are 45% better off. Sorry millennials!
Cost of a property
"Millennials are earning four times more than I did at their age. If they scrapped their holidays and cafe breakfasts they'd be able to purchase a home too," argue the older generations.
Potentially, but property prices have long-since eclipsed wage growth. In 1985, the price of a standard home in a capital city was approximately $72,872 – around 3.5 times higher than the average annual wage. Although house prices have fallen in recent months, the average cost of a home in the capital cities has sky-rocketed to $536,377. This is more than 6 times higher than the average annual income ($89,123) and 7.3 times more expensive than the cost of a home in 1985.
This means that as a young baby boomer, buying a home was more affordable as a proportion of income. In 1985, if the average person saved 80% of their salary, it would take them 11 months to afford a 20% deposit on a property. These days, it would take 20 months to save for a 20% deposit if you saved that same proportion of your income.
Stamp duty costs
Think stamp duty is depressing? Try being a millennial. In 1985, newly minted home owners would have paid around $1,364 in stamp duty costs on average. These days, you're likely to be slapped with a fee of $23,621 – 17.3 times higher than it was in 1985, despite the average house value increasing just 7.4 times in comparison.
But millennials have a useful card up their sleeve thanks to the government's first home owner assistance packages. While these differ slightly between the states and territories, the premise remains the same: eligible first home buyers can apply for a $10,000 government grant to put towards their house deposit, or a full or partial exemption from stamp duty. This can significantly reduce the overall cost of purchasing a home in 2020, whereas boomers had to fend for themselves.
Monthly repayments
If you owned a home in a capital city in 1985, your mortgage payments would have set you back around $482 per month on average. But In 2020, this has escalated to a cool $2,200. This means millennials are spending around 4.6 times more than baby boomers did on their mortgage repayments back in the day.
"But this is all relative to your monthly salary. Young people earn a lot more than the older generations did," one might argue. Not necessarily. The average monthly salary for a baby boomer in 1985 was $1,734. This means they spent around 28% of their income on their mortgage (assuming they had one). These days, the average monthly salary has increased to $7,427, but homeowners will need to spend around 30% of their income on mortgage repayments.
Total paid for the average house
For the price of a standard capital city property, a 20% deposit and stamp duty in 1985, baby boomers could expect to pay $189,508 in total. If they were to purchase a home in 1985, at today's current interest rate of 5.23%, they'd be paying around 1.7 times more than the property's overall value.
As for millennials in 2020? They'll need to fork out a whopping $1,103,596 for the same thing. This means younger Aussies are paying 4.9 times more for a home overall than baby boomers did, despite earning just 4.3 times more. If millennials were to purchase a home in 2020, with the average 1985 interest rate of 9.31%, they'd be paying around 2.6 times more than the property's overall value.
The verdict
According to the numbers, it's millennials who are losing out the most when it comes to property affordability, despite record low mortgage interest rates and a recent dip in house prices.
In 1985, low property prices and high interest rates made saving for a house deposit far quicker and easier than it is today. Interest rates in the late 1980s didn't stay high for long either. This means baby boomers got to benefit from a drop in home loan interest rates over the following years, along with a spectacular rise in property prices.
Average income growth is also forecast to be at its weakest point in 60 years over the next decade. This means paying off the mega mortgage of today is going to be more difficult amid increasing levels of household debt and minimal savings rates.
So, next time the boomer versus millennial housing debate rears its ugly head at the dinner table, young people can rest assured that, according to these figures, the oldies did in fact have it easier. Now pass us the avocado.
Finder is a comparison service. We do not compare every product or every provider in the market.
We make money through commercial arrangements with some of the providers on this site. Products marked 'Sponsored', 'Promoted', 'Featured' or 'Advertisement' appear as a result of a commercial arrangement.
Our editorial content, product reviews and any 'Top Pick' designations are prepared independently of these commercial arrangements.
The default order of products in our tables can be influenced by commercial arrangements. You can re-sort or filter using the controls above each table.
Some content on this site may be generated or supported by AI tools. You should verify details directly with the provider.
Finder is one of Australia's leading comparison websites. We are committed to our readers and stand by our editorial principles.
Our comparison service does not include every product or every provider in the market. Some product issuers offer their products under multiple brands or through associated companies. Where we can, we identify the underlying issuer so you can compare like with like, but you should always check with the provider directly to confirm which brand you are dealing with.
Finder is a comparison website and an intermediary. We are not a product issuer and we do not provide personal financial or credit advice. When you click a link to a product, or apply for a product through our site, you deal directly with the product issuer. We may receive a referral fee, commission or other payment from the issuer if you click through, apply or take out a product. We describe these arrangements in more detail under 'How we make money' below.
Product features, fees, terms and eligibility criteria are set by the product issuer and may change. We rely on information supplied by issuers when we present product details on our site. Before you apply for or take out any product, you should confirm the details directly with the issuer.
We earn revenue from Finder in four principal ways:
Referral fees and commissions. When you click a product link, complete an enquiry form or apply for a product through our site, we may receive a referral fee, commission or other payment from the product issuer. We may also receive payment based on the volume of leads or conversions we send to an issuer.
Sponsored placements. Products marked 'Sponsored', 'Promoted', 'Featured' or 'Advertisement' appear as a result of a commercial arrangement between Finder and the issuer. These labels always indicate a paid placement. We do not use them for editorial choices.
Display advertising. Banner advertising, newsletter advertising and similar display ads on our site are paid by advertisers.
Content sponsorship. Some articles, videos and social media posts are sponsored by an issuer and are clearly labelled as such.
Our editorial opinions, product reviews and any 'Top Pick' designations are prepared independently of these commercial arrangements. A 'Top Pick' is an editorial choice made by our writers and editors based on the criteria described on each comparison page. A 'Top Pick' is not a personal recommendation and does not mean the product is appropriate for your circumstances.
If you would like to know whether we have a commercial arrangement with a specific product issuer, please contact us.
When products are grouped in a table or list, the default order can be influenced by commercial arrangements we have with product issuers. In some categories, sponsored or featured products appear in the top positions of the table by default, and are always labelled as such.
Other factors that influence default order include price, fees and features, and (where relevant) our editorial view of the product.
You can re-sort every comparison table using the controls above the table. You can filter by product features that matter to you. The order you see after re-sorting or filtering is not influenced by commercial arrangements.
Some content on this site is generated or supported by artificial intelligence tools, including our AI-powered assistant FinderBot. AI-generated content may contain errors. Please verify important information directly with the product issuer before making a financial decision. For more information about FinderBot, see the FinderBot Terms of Use and FinderBot Privacy Collection Notice.
Please read our website terms of use and privacy policy for more information about our services and our approach to privacy.
We update our data regularly, but information can change between updates. Confirm details with the provider you're interested in before making a decision.
Our goal is to create the best possible product, and your thoughts, ideas and suggestions play a major role in helping us identify opportunities to improve.