Boom or bubble: What the next 24 months will look like for the Australian property market

The last 24 months have been some of the most dramatic on record for the Australian property market. In this article, I'll take a look back at the market movements over the last two years, and examine what Finder's panel of economists and property experts predict is in store for the next 24 months.
Australia has many different property markets, which all respond slightly differently to economic pressures. In order to look at national trends generally, we need to distil all these markets down into one number that we can use as a barometer representing the market in general. As over 70% of Australians live in cities, what we are going to do in this video is take a look at the average sales price of both houses and apartments in every city with over a million residents – so we are looking here at the three-month rolling average price of both houses and apartments in Sydney, Melbourne, Brisbane, Perth and Adelaide.

2019
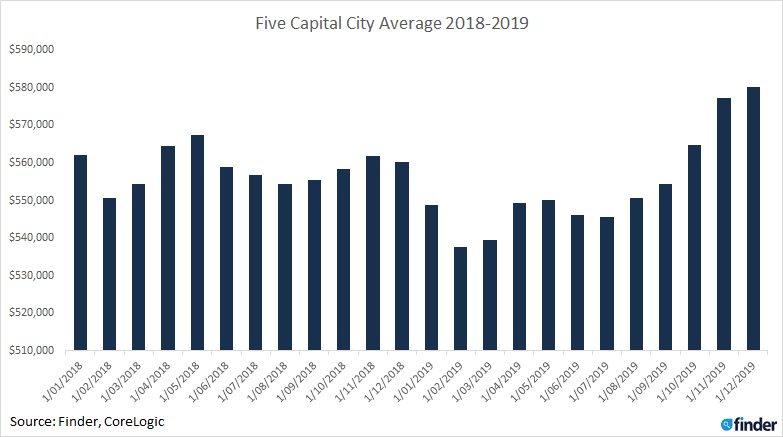
It's safe to say that the Australian property market experienced somewhat of a hiccup in 2019. The chart above depicts the average national price for houses and apartments across every month of 2018 and 2019. While the market had been following a very slight downward trend since 2017, house prices took a significant dip at the start of 2019 and remained low for most of the year. Not until October and November that year did the rolling average start to recover. What drove this recovery? While there were many factors at play in Australia's property price recovery towards the end of 2019, the main driver was cheap credit as provided by the cash rate.
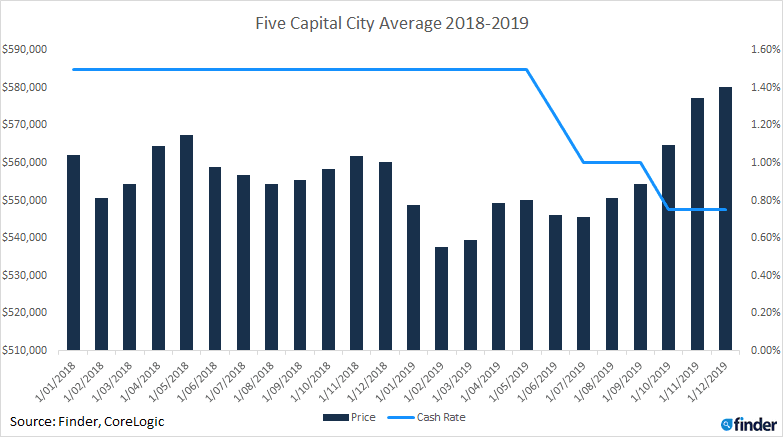
The cash rate determines the cost that your bank pays to the Australian central bank to borrow money. A high cash rate means that borrowing is expensive, and banks become more reliant on the cash in their (digital) vaults. A low rate has the opposite effect. When the rate is low, the banks can borrow money at a cheaper rate and therefore lend it to their customers at a cheaper rate. Thus when the Reserve Bank of Australia sets the cash rate low, the bottom rung of the housing ladder becomes easier to reach for first-time buyers.
If we lay the cash rate on top of the same price chart, you will see that it fell from a flat 1.5% through all of 2018 to 0.75% by December 2018, which drove the cost of borrowing into the ground. Along with some extra government stimulus to encourage more first-time buyers into the market, this helped re-ignite the embers under the housing market and get prices rising again.
An Aside: Ireland
I'm Irish. Though I've been living in Australia for 11 years, I was in Ireland through the market crash of 2007 when a collapsing sub-prime market in the US caused a collapse that rolled on to most of the world (though not Australia – much). Property prices rose pretty steadily in the years prior to the crash and dropped dramatically after. In fact, they still have not recovered. A quick look at the property price index on Trading Economics will show you that prices lost 50% of their value from a high in 2007/8 to a low in 2013. While prices have recovered somewhat since, the index is still 12% lower than at its peak.
Ireland's history shows why perpetual property price increases are not always a good thing. Nobody uses the phrase "safe as houses" in Ireland any more. In the rest of this article, I'll take a look at what happened to this tentative recovery after COVID-19 decimated the economy in 2020, and what we're facing next.
2020
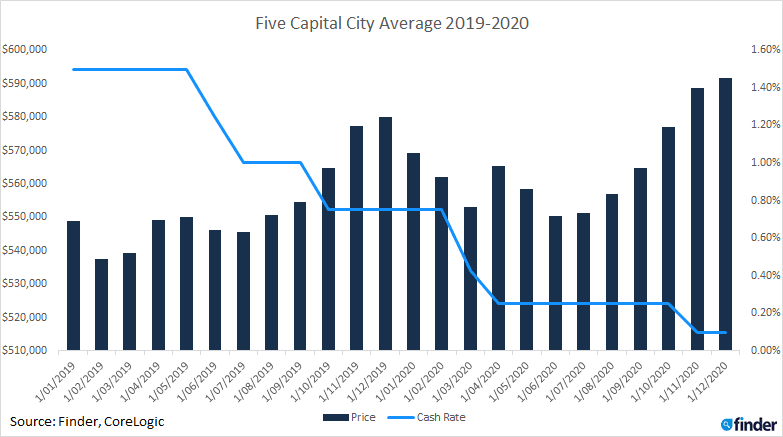
As you can see above, the recovery didn't last long. Prices began to dip again in early 2020, just as strict lockdowns started to roll out across the country. In response, the RBA cut the cash rate even further. This, along with other stimulus measures, resulted in prices heading north again in late 2020.
It's difficult to underestimate just how remarkable this is. Sydney's median house price, for example, passed $1m in November – for the first time since 2017. It has, in fact, only passed this figure four times. To further emphasise how fast and dramatic this recovery has been, let me show you one more chart.

The chart above depicts the total volume borrowed to fund owner-occupier home loans in Australia over the last three years. I was very surprised to see Australia's borrowing recover from a low of $11b mid-year to an all-time high of $16b in September. From there, the market continued to surge like a phoenix from its ashes. $16.5b in October was followed by $18b in November and a barmy $20b in December 2020.
So here we are – a combination of rock-bottom credit, government stimulus and FOMO driving prices through the roof. So, what's next?
2021/22
We survey 40 leading economists every month as part of our RBA Cash Rate Survey. As per our March survey, no economists expected a cash rate rise this year. About half expected one in 2022, while the other half didn't expect to see a cash rate rise until 2023 or later. What this means is that even though home loans are unlikely to get much cheaper, they are likely to remain cheap for the foreseeable future.
In March, we asked experts for their predictions of where the Australian property prices will be by the end of 2022. Panellists, on average, expected a 12% price rise across the country over the next 24 months. If you're wondering what that would do to our chart, here is the result.
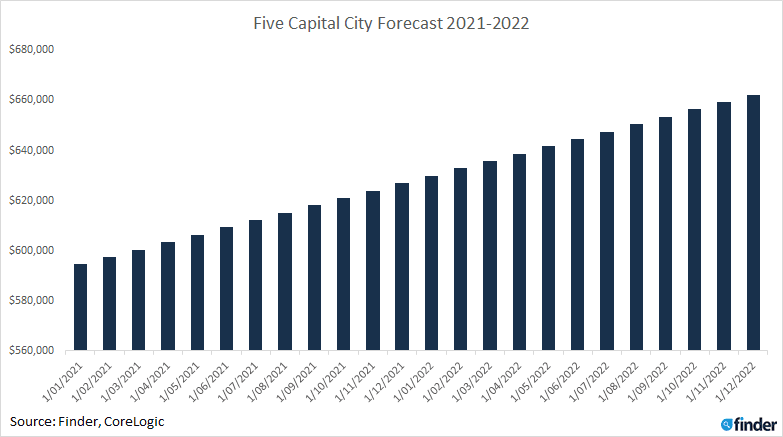
Three things are worth noting here. Firstly, the bars in the above chart start at $500k. Secondly, nobody is expecting prices to rise in a linear fashion like this. We will see ups and downs, but this gives you a good picture of the potential endpoint. And finally, in order to keep the question simple, we did not ask economists in this round of the survey for predictions about specific cities or property types. There's potential for a higher increase in some cities and a lower increase in others.
Having said all that, let's take a look at what a potential 12% could look like in Australia's biggest property market – Sydney.
Houses
| City | Current CoreLogic median price | Forecasted price | Gain |
|---|---|---|---|
| Sydney | $1,010,000 | $1,131,200 | $121,200 |
| Melbourne | $780,000 | $873,600 | $93,600 |
| Canberra | $767,000 | $859,040 | $92,040 |
| Brisbane | $575,000 | $644,000 | $69,000 |
| Hobart | $565,000 | $632,800 | $67,800 |
| Perth | $526,250 | $589,400 | $63,150 |
| Darwin | $513,500 | $575,120 | $61,620 |
| Adelaide | $510,000 | $571,200 | $61,200 |
The table above shows the current 3-month rolling average house price in each capital, followed by what a 12% increase would look like. As you can see, it results in some pretty dramatic increases.
A 12% increase in Sydney, for example, would add $120k to the value of the average house. A recent report from the Australian Bureau of Statistics puts the median Aussie income at around $48,360 – meaning that homeowners in Harbour City will be earning 24% more than the average income, just by living in their homes.
Apartments
Apartments, however, may not fare quite as well. While unit prices have continued to increase for now – the closing of international borders to students and continued use of distance learning has resulted in reduced rental incomes for landlords across the country. This has resulted in apartments being seen as rather a risky investment.
| City | % who believe apartments are a risky investment | % who believe houses are a risky investment |
| Melbourne | 68% | 24% |
| Brisbane | 68% | 14% |
| Sydney | 61% | 23% |
| Perth | 60% | 30% |
| Adelaide | 53% | 15% |
We asked our panel if they thought houses or apartments were a somewhat risky investment in the current climate. The results for apartments were far higher than those for houses in every city. In fact, 68% of experts believe apartments in Sydney and Melbourne could be a risky investment.
A bubble?
We also asked the panel how much of an increase in house prices would indicate the possibility of a bubble forming.
This first thing to note here is that very few experts – only 3 out of the 28 who answered the question – said there was no chance of a bubble forming. The rest said that an increase of 23%, on average, would be sufficient for them to say that we are experiencing a property bubble. Somewhere between 12% and 23% is where a grey area lies.
There are other factors that indicate that the house price gains may be unjustified. The gap between wage growth and house price growth keeps widening, for example. However, Australia's national house price to income ratio remains moderate internationally, ranking 27th out of 34 countries globally according to Statista - well behind the US, Canada, Germany and even Ireland.
And finally...
So there you have it. The experts predict a 12% price increase over the next 24 months. What this means is that the two windows of opportunity for first-time buyers may have closed. In an environment where credit is cheaper than ever, now may be the time to start looking at dipping your toes in. Remember, though, that markets can go up as well as down. Above all, choose where you want to buy based on where you want to live, and not the prospect for property price increases – but maybe be a little more cautious around apartments.
For more articles like this, you can check out Finder's Insights Blog or follow me directly on Twitter.
Finder's Insights Blog examines issues affecting the Australian consumer. It appears regularly on finder.com.au.
The economists and property experts who took part in this month's survey were: Nicholas Frappell, ABC Bullion. Shane Oliver, AMP Capital. John Hewson, ANU. Rebecca Cassells, Bankwest Curtin Economics Centre. David Robertson, Bendigo Bank. Sean Langcake, BIS Oxford Economics. Ben Udy, Capital Economics. Peter Boehm, CLSA Premium . Stephen Halmarick, Commonwealth Bank. Saul Eslake, Corinna Economic Advisory. Craig Emerson, Emerson Economics. Mark Brimble, Griffith University. Tony Makin, Griffith University. Alex Joiner, IFMinvestors. Michael Witts, ING. Leanne Pilkington, Laing+Simmons. Nicholas Gruen, Lateral Economics. Mathew Tiller, LJ Hooker. Geoffrey Kingston, Macquarie University. Jeffrey Sheen, Macquarie University. Stephen Koukoulas, Market Economics. Michael Yardney, Metropole Property Strategists. Mark Crosby, Monash University. Julia Newbould, Money magazine. Susan Mitchell, Mortgage Choice. Dr Andrew Wilson, My Housing Market. Rich Harvey, Propertybuyer. Matthew Peter, QIC. Noel Whittaker, QUT. Cameron Kusher, REA Group. Jason Azzopardi, Resimac. Sveta Angelopoulos, RMIT. Christine Williams, Smarter Property investing. Pty Ltd. Brian Parker, Sunsuper. Jonathan Chancellor, Urban.com.au. Dale Gillham, Wealth Within.
Picture: Getty/Shutterstock
Ask a question
