Financial security, like owning a home or paying off debt, significantly increases happiness for Australians.
Prioritising strong relationships and having insurance coverage also correlate with higher reported happiness levels.
A reliable home internet connection makes a tangible difference, with 85% of satisfied users reporting joy.
What is the key to happiness?
Some equate happiness with wealth, others with health. Some happy people are content with the relationships they keep. Others attain happy calm, faithful in the existence of a higher being.
What is the key to happiness? Decoding how to find happiness is a hot topic explored in almost every branch of human knowledge and every other person has something to say.
What makes you happy?
Finding happiness — trends in Australia
Finder's Consumer Sentiment Tracker (CST) found the majority of Australians consider themselves happy. Results from over 60,000 respondents also show what makes people happy — and though money definitely makes a difference, it may take more than raking in big bucks to enjoy a happy life.
Finder CST also reveals other interesting happiness trends among Aussies summed up below.
Key findings
8 in 10 Aussies are happy.
Women are almost as happy as men despite earning less and saving less.
Baby boomers are the happiest generation while Gen X are the least cheerful.
Married people are happier than those who are divorced, separated, or never married.
Increasing income results in a rising number of happy people but only in lower income brackets.
People who are not paying off debt are more likely to be happy.
Homeowners are happier than renters.
Those who have insurance coverage are more likely to be happy.
Having a reliable home broadband makes people happy.
Those who put more trust in the Government are more likely to be happy.
Happiness, age, gender, and location
Finder research reveals that overall, 77% of Australians consider themselves happy.
A greater proportion of men report being happier (78% vs. 76% women).
Happiness and gender
Happiness and gender
Gender
Yes
Males
78
Females
76
Baby Boomers are the happiest people, reporting 4% more than Gen Z, the second happiest bunch. Gen X — or the so-called "sandwich generation" for being placed right smack in the middle of caring for both underaged children and ageing elders — are the least cheerful of all.
Happiness and age
Happiness and age
Generation
Yes
Baby boomers
82
Gen X
73
Gen Y
77
Gen Z
78
Across generations, Finder CST shows males are consistently happier than females. The largest gap (4%) seen between the sexes were among Gen Z.
Happiness, age, and sex (Males)
Happiness, age, and sex (Males)
Generation
Yes
Baby boomers
82
Gen X
74
Gen Y
78
Gen Z
81
Happiness, age, and sex (Females)
Happiness, age, and sex (Females)
Generation
Yes
Baby boomers
81
Gen X
72
Gen Y
77
Gen Z
77
Most Metro and Regional residents (77%) say they're happy. At the state level, those from ACT scored the highest proportion of happy residents (81%), while TAS residents scored the lowest (74%).
Happiness statistics over time shows that the proportion of happy Aussies are almost back to pre-pandemic levels (76%) and are almost at the same level as it was same period last year.
Happiness over time (2019 to 2024)
Happiness over time (2019 to 2024)
Month
Yes
5/1/19
78.33
6/1/19
76.55
7/1/19
79.37
8/1/19
78.24
9/1/19
79.13
10/1/19
78.01
11/1/19
77.27
12/1/19
79.22
1/1/20
78.14
2/1/20
80.04
3/1/20
77.06
4/1/20
69.01
5/1/20
72.88
6/1/20
76.79
7/1/20
78.85
8/1/20
73.10
9/1/20
76.24
10/1/20
77.55
11/1/20
76.59
12/1/20
79.98
1/1/21
80.38
2/1/21
80.35
3/1/21
80.30
4/1/21
79.92
5/1/21
79.75
6/1/21
77.87
7/1/21
75.96
8/1/21
75.37
9/1/21
75.87
10/1/21
76.35
11/1/21
77.44
12/1/21
76.11
1/1/22
78.40
2/1/22
73.94
3/1/22
74.07
4/1/22
76.49
5/1/22
78.44
6/1/22
75.82
7/1/22
79.31
8/1/22
78.92
9/1/22
80.23
10/1/22
77.61
11/1/22
76.93
12/1/22
76.22
1/1/23
80.83
2/1/23
79.04
3/1/23
77.74
4/1/23
79.05
5/1/23
78.02
6/1/23
78.07
7/1/23
74.48
8/1/23
76.23
9/1/23
76.20
10/1/23
74.01
11/1/23
72.25
12/1/23
76.23
1/1/24
76.82
2/1/24
75.98
3/1/24
74.76
4/1/24
76.00
Happiness, wealth, and assets
Researchers have found financial stress and security to be significant predictors of overall happiness, and no less important than physical health or personal relationships. The ability to pay bills on time, repay debts and afford basic necessities alleviates anxiety.
Not surprisingly, how much we own impacts what makes us happy. Even so, Finder found happy women and men may be coping differently. The same thing holds true for Aussies belonging to different generations.
Happiness and household income
Household income is positively related to happiness. Less than two-thirds (64%) of households earning between $10,000 and $20,000 per year report feeling happy, compared to 87% of those earning above $200,000.
Happiness and household income
Happiness and household income
Combined Household Income
Count
Less than $10,000
69.28
$10,000 - $19,999
63.50
$20,000 - $29,999
66.58
$30,000 - $39,999
71.36
$40,000 - $49,999
75.65
$50,000 - $59,999
75.53
$60,000 - $69,999
76.56
$70,000 - $79,999
77.16
$80,000 - $89,999
78.08
$90,000 - $99,999
78.91
$100,000 - $149,999
81.88
$150,000 - $199,999
85.09
$200,000 - $249,999
87.22
$250,000+
87.50
However, the chart does show that an increase in income makes the most difference to happiness in lower income brackets. For those with higher incomes, a marginal improvement on happiness is evident.
Those earning less than $10,000, who are happier than those earning between $10,000 and $30,000, is an exception. While it's difficult to say what makes people happy for those belonging to the lowest income bracket, results likely reflect the sentiment of the younger student population whose wealth and potential may not be accurately reflected.
Happiness, personal income, and savings
The proportion of happy people gradually increases with increasing personal income. This is true for Aussies earning between $10,000 and $250,000. Beyond that, happy people drop from 91% to just 84% — 7% lower than those earning between $200,000 and $250,000.
Happiness and personal income
Happiness and personal income
Personal income
Count
Less than $10,000
71.89
$10,000 - $19,999
71.12
$20,000 - $29,999
71.88
$30,000 - $39,999
75.65
$40,000 - $49,999
77.98
$50,000 - $59,999
79.31
$60,000 - $69,999
79.57
$70,000 - $79,999
81.04
$80,000 - $89,999
82.68
$90,000 - $99,999
82.93
$100,000 - $149,999
84.91
$150,000 - $199,999
88.40
$200,000 - $249,999
91.42
$250,000+
83.83
Results make it appear that money may not be all what it takes to make a good life possible. Finder CST results are consistent with research from the University of Pennsylvania.
Researchers found money is a consistent driving factor for happiness as income rises. However, at higher income levels, money becomes less relevant than other factors like health and relationships in attaining happiness in life.
When happiness and income are broken down further to reflect males vs. females, it seems women's happiness is less driven by how much money they make. More women (73% vs. 79% men) who make between $10,000 and $20,000 report being happy yet fewer women (82% vs. 90% of men) who make between $150,000 and $200,000 feel happy.
Happiness and personal income (Males)
Happiness and personal income (Males)
Personal income
Count
Less than $10,000
68.17
$10,000 - $19,999
68.85
$20,000 - $29,999
69.99
$30,000 - $39,999
76.19
$40,000 - $49,999
77.69
$50,000 - $59,999
80.33
$60,000 - $69,999
79.73
$70,000 - $79,999
82.45
$80,000 - $89,999
83.30
$90,000 - $99,999
82.66
$100,000 - $149,999
86.20
$150,000 - $199,999
89.67
$200,000 - $249,999
92.20
$250,000+
85.08
Happiness and personal income (Females)
Happiness and personal income (Females)
Personal income
Count
Less than $10,000
73.42
$10,000 - $19,999
72.76
$20,000 - $29,999
73.43
$30,000 - $39,999
75.24
$40,000 - $49,999
78.22
$50,000 - $59,999
78.31
$60,000 - $69,999
79.41
$70,000 - $79,999
79.40
$80,000 - $89,999
81.77
$90,000 - $99,999
83.44
$100,000 - $149,999
81.68
$150,000 - $199,999
82.07
$200,000 - $249,999
87.50
$250,000+
78.95
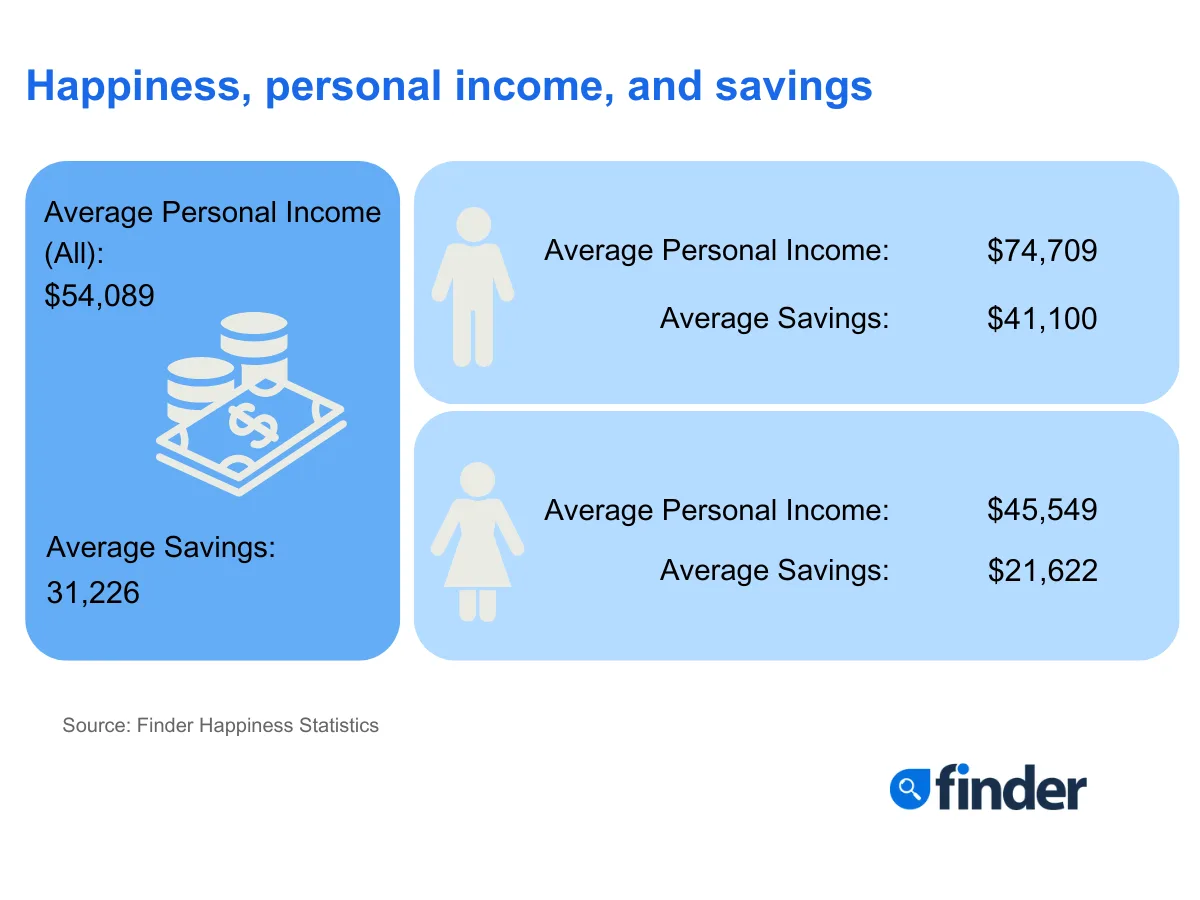
While the percentage differences in happiness between the sexes may seem insignificant, how much each group earns on average clearly shows gender pay gap in Australia is still very real. The average personal income of women is only about 60% of that of men. Yet, despite this fact, women are experiencing happiness at about the same level as men.
On average, Aussies have $31,226 set aside as savings. Men have almost double ($41,100) what women have ($21,622). Unhappy men even saved a little more ($25,090) than happy women ($24,040).
It's not surprising then that Finder found more women claim they're able to live off their savings for less than a week (17% vs. 8% of men). What's striking is that a greater proportion of women who said so were happier (4% more) than men living under the same circumstances.
Happiness and period able to live off savings (Males)
Happiness and period able to live off savings (Males)
Period
Count
0.5
61
1
79
2
79
3
84
4
81
8
80
12
81
20
85
36
86
52
87
Happiness and period able to live off savings (Females)
Happiness and period able to live off savings (Females)
Period
Count
0.5
65
1
75
2
77
3
78
4
80
8
81
12
83
20
84
36
84
52
87
Happiness and job security
Working a job can mean waking up with a purpose, affording needs, and providing for dependents. Finder asked if the ability to keep a roof over your head indeed could contribute to making a happy person.
Most respondents (89%) who felt secure keeping their means of livelihood said they were happy. A downward trend in the proportion of happy people was observed as the perceived level of job security decreased.
Happiness and job security
Happiness and job security
Job security
Count
Very secure
89
Somewhat secure
83
Neutral
75
Somewhat insecure
63
Very insecure
50
Happiness and financial stress
Advice on how to be happy may go beyond measuring your means but what you have certainly impacts your sense of fulfilment.
Finder CST data shows happiness decreases as perceived financial stress increases. Overall, the same proportion of happy men and women (92%) who said they do not feel financially stressed at all was observed.
Meanwhile, among those who felt extremely stressed by their financial situation, only 46% of women said they were happy — i.e., 5% below the proportion of men who were happy under the same circumstances.
Happiness and financial stress
Happiness and financial stress
Stress level
Count
Not at all stressed
92
Slightly stressed
85
Somewhat stressed
73
Very stressed
60
Extremely stressed
46
Happiness and financial stress (Males)
Happiness and financial stress (Males)
Stress level
Count
Not at all stressed
92
Slightly stressed
84
Somewhat stressed
71
Very stressed
59
Extremely stressed
51
Happiness and financial stress (Females)
Happiness and financial stress (Females)
Stress level
Count
Not at all stressed
92
Slightly stressed
86
Somewhat stressed
75
Very stressed
62
Extremely stressed
43
Combined gender and generational data reveal interesting trends in happiness as well.
Among Baby Boomers, a higher proportion of Aussie women who are extremely stressed reported being happy (35% vs. 30% men). For women belonging to Generations X (34% vs. 46% men), Y (47% vs. 60% men), and Z (48% vs. 59% men) a consistently lower percentage reported feeling extremely stressed but happy at the same time.
Studies have shown that financial security is one of the leading determinants of happiness among retirees so it's worth taking a hard look at your superannuation before you get there.
Choose a high-performing fund to ensure you make the most of compound growth over time, and try to keep your annual fees below 1% of your balance per year.
If you can, salary sacrificing part of your income allows you to contribute to your fund before tax, paving the path for a healthy and stress-free retirement.
Happiness and assets owned
Assets like properties and cars are things that could make anybody happy. Not only do these assets provide comfort and convenience, but also financial stability. Nonetheless, maintenance requires spending, at least until after assets are sold.
Happiness and home ownership
Australians are obsessed with property, and home ownership is often taken as a sign that a person has achieved financial freedom.
Finder survey results show homeowners who have paid off their mortgage are the happiest (85%), followed by those who are still paying off their mortgage (80%). The lowest proportion of happy people was reported by renters (70%).
Happiness and condition of residence
Happiness and condition of residence
Primary residence
Count
I currently own - house/unit fully paid off
85
I currently own - currently paying mortgage
80
I currently rent and also pay a mortgage on another property
79
I currently pay a mortgage and live at home
78
I am not currently paying a mortgage or rent
70
I currently rent
70
Other
71
Respondents who are not homeowners were further asked when they see themselves buying a property. Majority of respondents (28%) said they don't think they'll ever be able to afford it. Of those, about half were unhappy. Meanwhile, those who see themselves owning a home within the next 1 to 5 years (27%) reported the highest proportion of happy people.
Happiness and prospect of home ownership
Happiness and prospect of home ownership
Prospect of home ownership
Happy
Unhappy
Within the next 12 months
5
1
In 1-5 years
21
6
In 6-10 years
12
4
In 11-15 years
4
2
In 16-20 years
2
1
20+ years
2
1
Never, I don't think ill ever be able to afford it
14
12
Never, I'm not interested
9
3
About 33% of respondents said they're struggling to pay for rent or home loan. Among those who struggle, majority (62%) still reported being happy (vs. 80% of those who don't struggle).
Happiness and whether or not struggling to pay rent or home loan
Happiness and whether or not struggling to pay rent or home loan
Struggling to pay
Happy
Unhappy
No
54
13
Yes
20
13
Happiness and car ownership
More than half (61%) of the respondents own just 1 car. Of whom, 77% reported being happy. Though the highest proportion of happy people were reported by those who own 2 cars (84%), followed by those who own 3 or more cars (82%).
Happiness and number of cars owned
Happiness and number of cars owned
Cars owned
Happy
Unhappy
0
8
4
1
47
14
2
19
4
3+
3
1
Happiness, debt, and spending
Finder asked respondents if they've ever paid late fees for bank loans, credit card bills, utilities, or buy now pay later service. Majority (72%) said they haven't. This group also reported the highest proportion of happy people.
Happiness and payment of late fees
Happiness and payment of late fees
Late fee paid on
Happy
Unhappy
Home loan
1
0
Personal loan
2
0
Credit card
6
2
BNPL
5
2
Energy bill
1
1
Phone bill
4
1
Broadband
1
0
None of the above
57
15
Credit cards
About 41% of respondents maintain just 1 credit card, majority of whom (79%) reported being happy. The highest proportion of happy credit card holders (83%), however were reported by those who have 3 credit cards, although only 4% of respondents had that many in their pockets.
Among those who don't use credit cards (36%), 7 in 10 were happy living without the plastic. Meanwhile, none of the respondents had 5 or more credit cards in their wallets.
Happiness and credit cards
Happiness and credit cards
Credit cards held
Happy
Unhappy
0
26
10
1
35
9
2
13
3
3
3
1
4
1
0
5+
0
0
The highest percentage of Aussies who don't use credit cards was observed among Gen Z (55%). Of whom, 3 in 4 said they were happy.
Happiness, credit cards, and Gen Z
Happiness, credit cards, and Gen Z
Credit cards held
Happy
Unhappy
0
41
14
1
27
6
2
8
1
3
2
0
4
0
0
5+
0
0
Among those who use credit cards, 3 in 5 said they can pay off their bills in a month. About 83% of whom reported being happy. Only 4% said they'd be able to pay off their credit card balances in full within 60 months. Half (53%) of this group reported being happy.
Not surprisingly, the longer it will take to pay off a person's credit card debt, the less likely they are to be happy.
Happiness and months it will take to pay off credit card debt
Happiness and months it will take to pay off credit card debt
Months to pay off
Happy
Unhappy
1
53
11
3.5
12
3
9.5
7
2
18
4
2
42
2
1
60
2
2
Home loan
We've seen that homeowners are happier than those identifying with other conditions of residence. Until that home loan is paid off, however, mortgage stress can be a powerful determinant of happiness.
Only 31% of respondents have availed of home loan. A whopping 58% don't have it nor ever plan on getting one. Of whom, 76% reported being happy vs. 81% of those who have a home loan.
Happiness and home loans
Happiness and home loans
Home loan status
Happy
Unhappy
I have this
81
19
I have this but plan to switch provider
85
15
I don't have this, but plan to get one
81
19
I don't have this and don't plan to get one
76
24
Personal loan
Only 14% have a personal loan. Of whom 79% are happy. Meanwhile, close to 8 in 10 (77%) reported not having this debt or ever plan on getting one. Of whom 76% are happy.
Happiness and personal loans
Happiness and personal loans
Personal loan status
Happy
Unhappy
I have this
11
3
I don't have this, but plan to get one
7
2
I don't have this and don't plan to get one
59
18
Car loan
Although Aussies who drive more than 1 vehicle said they were happier, it's doubtful that those who are paying off a car loan will be as ecstatic with their bills.
While only 1 in 10 have availed of a car loan, 9 in 10 reported being happy vs. 8 in 10 among those who don't and are not planning on getting one (78% of all respondents).
Happiness car loans
Happiness car loans
Car loan status
Happy
Unhappy
I have this
11
2
I don't have this, but plan to get one
7
2
I don't have this and don't plan to get one
59
19
Happiness and spending
If having more money is what makes people happy, do people who spend more or less feel any happier?
Finder asked respondents how positively or negatively they feel about their monthly spending. Less than half (46%) are within the spectrum of perceiving their spending as being positive although a high 9 in 10 reported being happy.
In contrast, among those who are pessimistic about their monthly spending (47%), only 6 in 10 (64%) reported being happy.
Happiness and feeling toward money spent every month to live
Happiness and feeling toward money spent every month to live
Feeling toward money spent
Happy
Unhappy
Extremely positive
11
1
Somewhat positive
30
4
N/A
6
1
Somewhat negative
24
10
Extremely negative
6
7
Happiness and Internet connection
Frustrated with your dodgy broadband? Finder CST revealed that the happiest people are those who say they are extremely satisfied with their Internet connection (85%) vs. 75% for those who are extremely dissatisfied.
Majority of respondents (46%) said they were somewhat satisfied with their home broadband. Of whom, 8 in 10 said they were happy.
Happiness and Internet satisfaction
Happiness and Internet satisfaction
Internet satisfaction
Happy
Unhappy
Extremely satisfied
23
4
Somewhat satisfied
36
10
Neither satisfied nor dissatisfied
10
4
Somewhat dissatisfied
7
3
Extremely dissatisfied
3
1
If uninterrupted Netflix and video calls bring you joy then it could be worth upgrading your home Internet.
Happiness and health
Does being healthy make a happy person or does being happy make a person healthy? If health is a determinant of happiness then happiness might as well come at a cost. That could mean shelling out about $160 a month — the cost of private health insurance.
About 16% of respondents said that the cost of health insurance stresses them out vs. about twice as many respondents (35%) saying the cost of rent or mortgage is what keeps them on their toes. Of those who are stressed by health insurance premiums, 4 in 5 said they were happy.
Happiness, bill stress, and health insurance
Happiness, bill stress, and health insurance
Bill type
Happy
Unhappy
Rent/mortgage
25
10
Groceries
20
9
Energy
17
7
Petrol
14
5
Council rates
13
4
Health insurance
13
3
Credit card
8
3
Car insurance
8
2
Home insurance
7
2
Mobile phone
5
2
Between the sexes, about 58% of men have health insurance vs. 53% of females. Of whom, 48% of men vs 42% women said they were happy.
Happiness and health insurance (Males)
Happiness and health insurance (Males)
Health insurance status
Happy
Unhappy
I have this
48
10
I don't have this, but plan to get one
8
2
I don't have this and don't plan to get one
23
10
Happiness and health insurance (Females)
Happiness and health insurance (Females)
Health insurance status
Happy
Unhappy
I have this
42
11
I don't have this, but plan to get one
8
3
I don't have this and don't plan to get one
26
11
Happiness and insurance
Apart from health insurance, Finder CST revealed a similar trend in happiness for other forms of insurance. A greater proportion of those who have insurance coverage reported being happy, specifically:
More than half of respondents (59%) have home and contents insurance. Of whom, 81% said they were happy vs. 68% of those who don't have this coverage.
Only about a fourth (24%) of respondents availed of life insurance coverage. Of whom 83% were happy, that is, 11% more than those who did not have cover.
About 17% of respondents had income protection insurance. Of whom 82% said they were happy vs. 75% of those who didn't have this.
Some 86% of those who have pet insurance said they were happy vs. 75% of those who did not.
Happiness and home and contents insurance
Happiness and home and contents insurance
Home and contents insurance status
Happy
Unhappy
I have this
48
11
I don't have this, but plan to get one
8
2
I don't have this and don't plan to get one
21
10
Happiness and life insurance
Happiness and life insurance
Life insurance status
Happy
Unhappy
I have this
20
4
I don't have this, but plan to get one
9
2
I don't have this and don't plan to get one
48
17
Happiness and income protection insurance
Happiness and income protection insurance
Income protection status
Happy
Unhappy
I have this
14
3
I don't have this, but plan to get one
9
2
I don't have this and don't plan to get one
54
18
Happiness and pet insurance
Happiness and pet insurance
Pet insurance status
Happy
Unhappy
I have this
12
2
I don't have this, but plan to get one
8
2
I don't have this and don't plan to get one
57
19
Insurance provides a sense of financial security in the event of sudden need, such as accidents. The coverage provided by these products help relieve anxiety and bring peace of mind.
Happiness and relationships
Research consistently shows that personal relationships and social connectedness are the leading indicators of happiness and wellbeing. The Harvard Study of Adult Development followed 268 men over the course of 80 years and found close relationships to be the number one factor in keeping people happy, mentally stimulated, and helping them to live longer.
Another study among retirees in China found social participation to have a significant impact on happiness and wellbeing later in life.
Trends in Finder CST reveal that those who are married or have partners registered the highest proportion of respondents who said they were happy (83%) vs. those who were divorced (69%), separated (63%), or never married (69%).
About 8 in 10 of those who are widowed said they were happy. Good experiences with deceased spouse or partners could be one of the reasons why a higher proportion of this group still reported being happy vs. respondents identifying with groups other than those who are married.
Happiness and marital status
Happiness and marital status
Marital status
Happy
Unhappy
Married/partnered
48
10
Divorced
5
2
Separated
2
1
Widowed
2
1
Never married
19
9
So keep your loved ones close and remember to invest time and effort in building your social networks.
Happiness and trust in the government
The Government has a key role to play as a facilitator of what makes people happy — security, personal growth, economic development, and closing social disparities where they exist to achieve equity and equality for all.
A third of Aussies (32%) have moderate trust towards the Government, followed by those who said they had little trust (24%) and do not trust the Government at all (20%). Those who said they trust the Government a lot (17%) follow with the least being those who said they trust the Government a great deal (7%).
Taking a closer look at the proportion of people reporting they are happy relative to the level of confidence they have for the Government, those who have a great deal of trust also exhibited the highest proportion of happy people (87%). Decreasing trust consistently showed a corresponding decrease in happiness. Those who reported the least trust in Government also showed the lowest proportion of happy people (76%).
Happiness and trust in the Government
Happiness and trust in the Government
Trust in the Government
Happy
Unhappy
A great deal
6
1
A lot
14
3
A moderate amount
26
6
A little
18
6
Not at all
13
7
World Happiness Report: AU ranks 10th
The World Happiness Index ranks Australia as the number 10 happiest place on earth in 2024, that is, two notches higher than in 2023. Results were based on responses collected between 2021 and 2023.
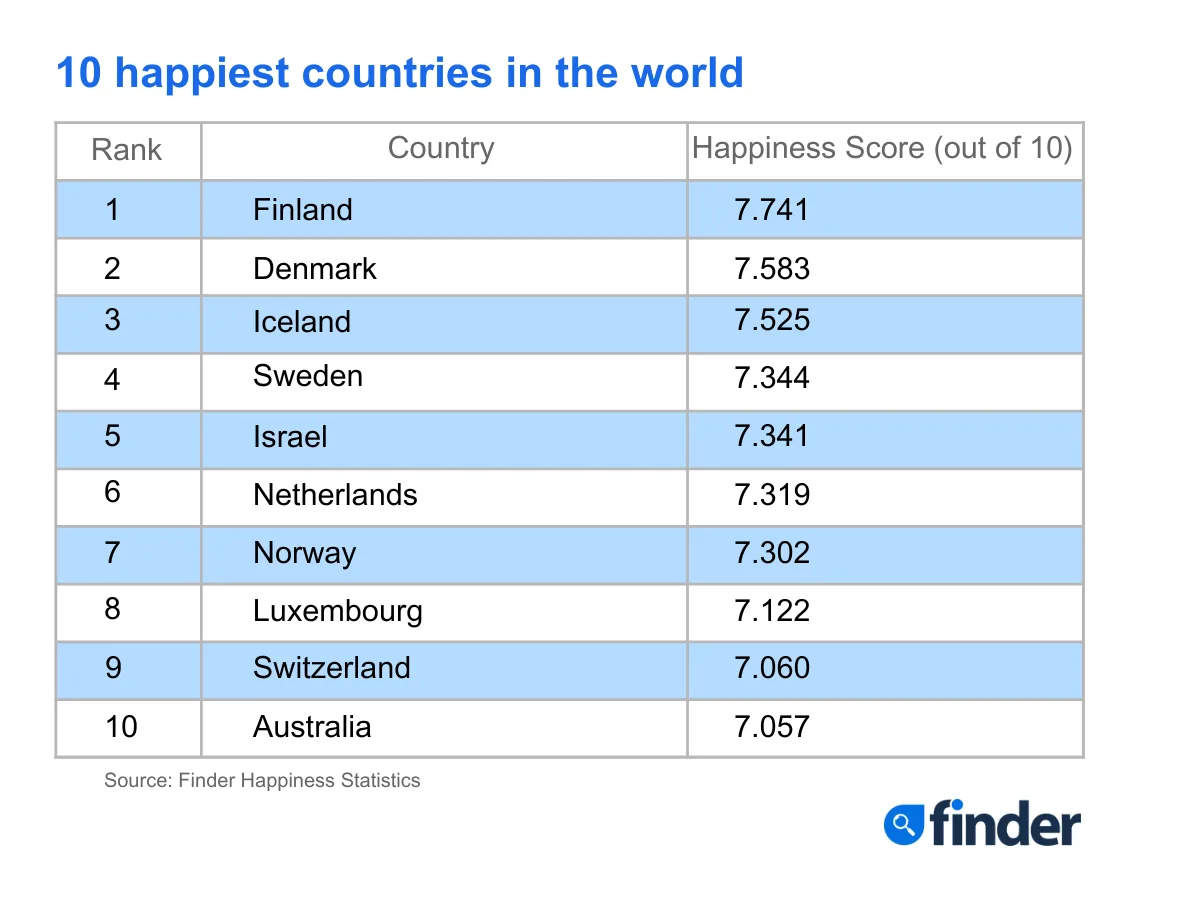
A total of 143 countries were included, with the Top 5 world happiest countries in 2024 being dominated by Finland, Denmark, Iceland, Sweden, and Israel. Finland has secured the highest ranking for the sixth year in a row.
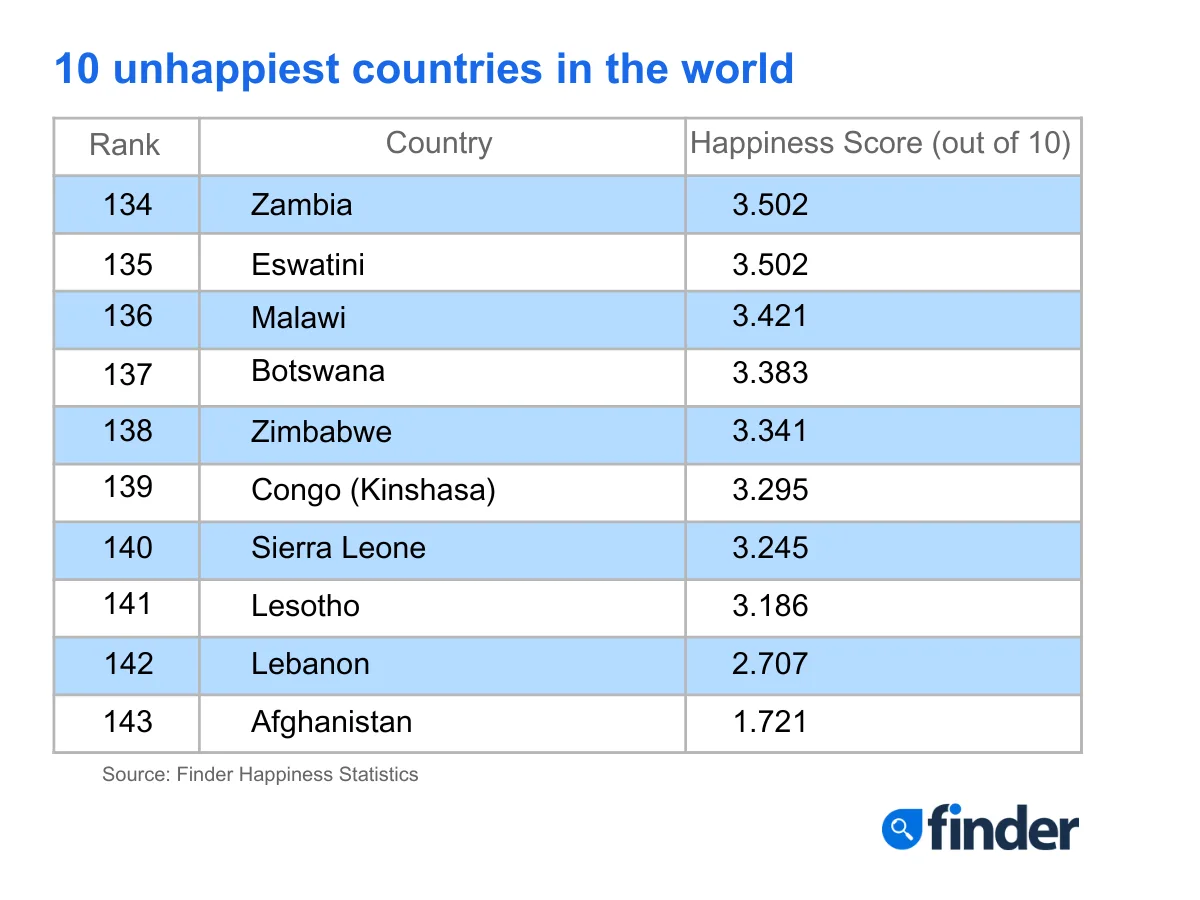
The five lowest ranking countries — Afghanistan, Lebanon, Lesotho, Sierra Leone, and Congo (Kinshasa) — are all located in areas of armed conflict, and correspond to lower-income countries. Results indicate that income, political instability, and national security are likely related to individual levels of happiness.
The World Happiness Report evaluates the level of happiness of each UN member state using both self-reported quality of life measures and a selection of socioeconomic indicators, including GDP per capita, life expectancy, social support, trust and corruption, perceived freedom to make life decisions, and generosity.
How to find happiness
Finder CST revealed a long list of what makes people happy. From owning assets to enjoying a reliable Internet connection to trusting the Government. It takes a lot of work to get to the level of being happy without wanting more, however. So, make sure to protect your assets and keep building towards your financial goals.
It's interesting to note how people do not seem to derive an unlimited supply of happiness from simply owning more material things. So don't let your most important relationships crumble while you chase your professional development or financial freedom. Make sure to put in time and effort to collect experiences and create wonderful memories with people you care about the most.
People will have different things to say about how to find happiness. What's more important is that you do what makes you happy.
Sophie Wallis is a senior insights analyst with a passion for data storytelling. She spends her time turning complex data into digestible stories and uncovering new consumer trends. When she isn't working, you'll find her planning her next overseas holiday or bingeing on a big novel. Sophie has a Bachelor of Economics from the University of Melbourne.
See full bio
Margaux Diaz is content marketing specialist at Finder. She supports the SEO team in content promotion and partnership building in the US and Australia. Prior to joining Finder, she managed health promotion and other social development projects for the United Nations and consulted for private non-profits, and government agencies. She has also written for publications and blogs in the health and wellness, beauty, fitness, non-profits, business, and finance spaces.
See full bio
Can AI effectively manage risk and deliver returns in real-world markets? To answer this question, we have deployed seven of the most advanced AI platforms — ChatGPT, Gemini, Copilot, DeepSeek, Perplexity, Meta AI and Grok — to act as portfolio managers.
Finder's Property Investment Index predicts price growth in each suburb across Australia's major cities. Find out how your suburb stacks up.
Important information about this website
Finder is a comparison service. We do not compare every product or every provider in the market.
We make money through commercial arrangements with some of the providers on this site. Products marked 'Sponsored', 'Promoted', 'Featured' or 'Advertisement' appear as a result of a commercial arrangement.
Our editorial content, product reviews and any 'Top Pick' designations are prepared independently of these commercial arrangements.
The default order of products in our tables can be influenced by commercial arrangements. You can re-sort or filter using the controls above each table.
Some content on this site may be generated or supported by AI tools. You should verify details directly with the provider.
Finder is one of Australia's leading comparison websites. We are committed to our readers and stand by our editorial principles.
Our comparison service does not include every product or every provider in the market. Some product issuers offer their products under multiple brands or through associated companies. Where we can, we identify the underlying issuer so you can compare like with like, but you should always check with the provider directly to confirm which brand you are dealing with.
Finder is a comparison website and an intermediary. We are not a product issuer and we do not provide personal financial or credit advice. When you click a link to a product, or apply for a product through our site, you deal directly with the product issuer. We may receive a referral fee, commission or other payment from the issuer if you click through, apply or take out a product. We describe these arrangements in more detail under 'How we make money' below.
Product features, fees, terms and eligibility criteria are set by the product issuer and may change. We rely on information supplied by issuers when we present product details on our site. Before you apply for or take out any product, you should confirm the details directly with the issuer.
We earn revenue from Finder in four principal ways:
Referral fees and commissions. When you click a product link, complete an enquiry form or apply for a product through our site, we may receive a referral fee, commission or other payment from the product issuer. We may also receive payment based on the volume of leads or conversions we send to an issuer.
Sponsored placements. Products marked 'Sponsored', 'Promoted', 'Featured' or 'Advertisement' appear as a result of a commercial arrangement between Finder and the issuer. These labels always indicate a paid placement. We do not use them for editorial choices.
Display advertising. Banner advertising, newsletter advertising and similar display ads on our site are paid by advertisers.
Content sponsorship. Some articles, videos and social media posts are sponsored by an issuer and are clearly labelled as such.
Our editorial opinions, product reviews and any 'Top Pick' designations are prepared independently of these commercial arrangements. A 'Top Pick' is an editorial choice made by our writers and editors based on the criteria described on each comparison page. A 'Top Pick' is not a personal recommendation and does not mean the product is appropriate for your circumstances.
If you would like to know whether we have a commercial arrangement with a specific product issuer, please contact us.
When products are grouped in a table or list, the default order can be influenced by commercial arrangements we have with product issuers. In some categories, sponsored or featured products appear in the top positions of the table by default, and are always labelled as such.
Other factors that influence default order include price, fees and features, and (where relevant) our editorial view of the product.
You can re-sort every comparison table using the controls above the table. You can filter by product features that matter to you. The order you see after re-sorting or filtering is not influenced by commercial arrangements.
Some content on this site is generated or supported by artificial intelligence tools, including our AI-powered assistant FinderBot. AI-generated content may contain errors. Please verify important information directly with the product issuer before making a financial decision. For more information about FinderBot, see the FinderBot Terms of Use and FinderBot Privacy Collection Notice.
Please read our website terms of use and privacy policy for more information about our services and our approach to privacy.
We update our data regularly, but information can change between updates. Confirm details with the provider you're interested in before making a decision.
Our goal is to create the best possible product, and your thoughts, ideas and suggestions play a major role in helping us identify opportunities to improve.