Mean reversion on AUD/USD Pair
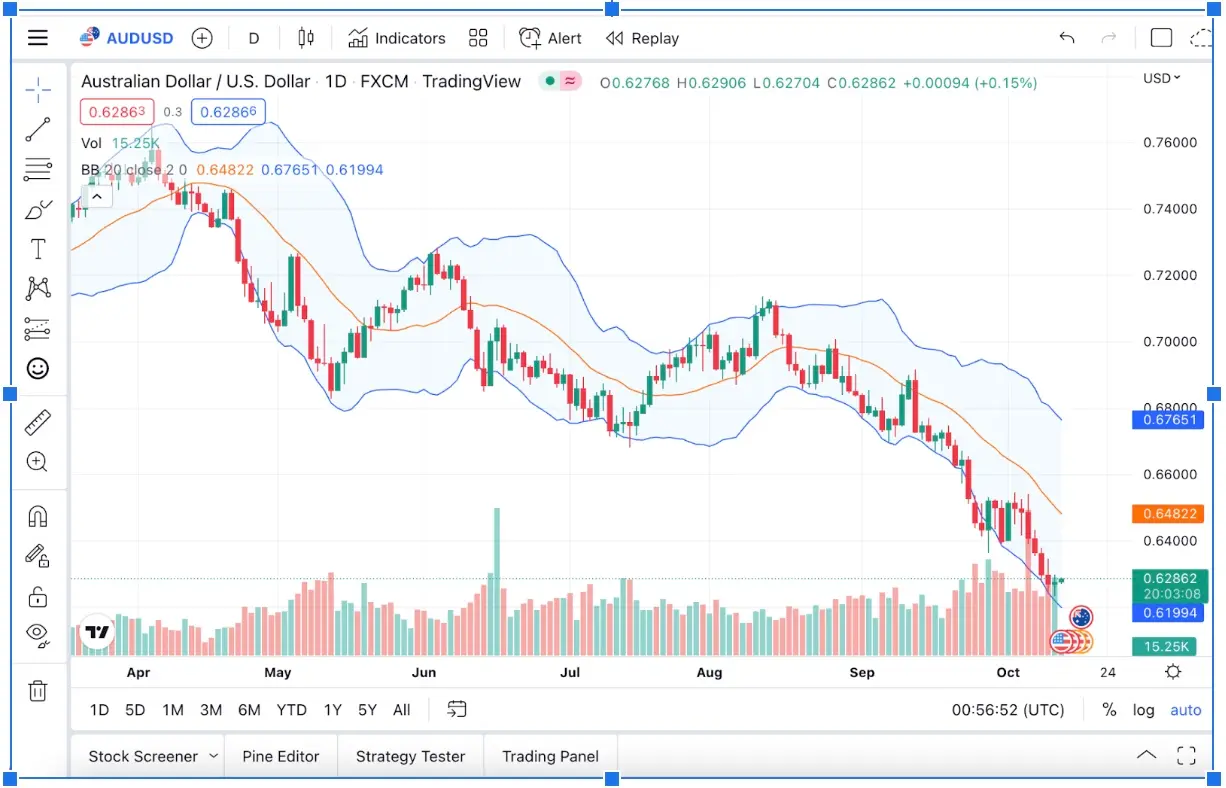
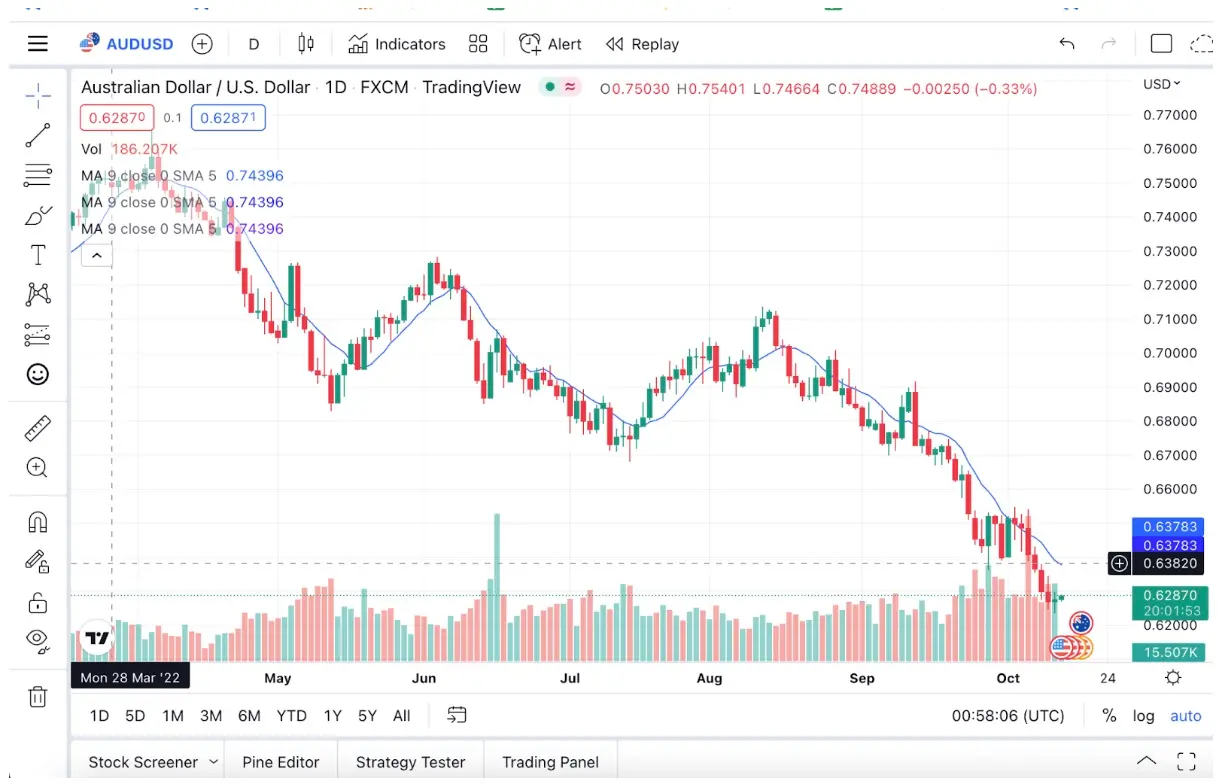
Olivia, a part-time forex trader based in Sydney, noticed that the AUD/USD currency pair had historically oscillated around the 0.6800 level over the past 6 months. Using Bollinger Bands and a 20-day simple moving average (SMA), she decided to test a mean reversion strategy.
Setup:
• Currency pair: AUD/USD
• Indicators: 20-day SMA, Bollinger Bands (2 standard deviations)
• Entry trigger: Price closes 2 standard deviations below the moving average
• Exit strategy: Close position when price returns to within 0.5% of the 20-day SMA
• Position size: $5,000
Trade Example (June 2025):
On 3 June, AUD/USD sharply dropped to 0.6560, well below the lower Bollinger Band and more than 3% below its 20-day average of 0.6820. Olivia interpreted this as an overreaction driven by a short-term news scare (weaker-than-expected GDP).
She entered a long position at 0.6560, targeting a return to the mean.
By 10 June, AUD/USD had bounced back to 0.6780, still below the SMA but within the reversion range. Olivia exited with a gain of 220 pips, or $1,100 profit (22% on her $5,000 position using 5:1 leverage).
By trusting historical price behaviour and using strict entry/exit rules, Olivia was able to capitalise on a short-term overreaction without trying to “catch the bottom”.