New analysis refreshes cryptocurrency wash trading allegations

Even while being appropriately wary of the methodology, there are some hard-to-ignore results.
A new report from the Blockchain Transparency Institute (BTI) has highlighted old discrepancies in a new way.
Wash trading allegations are nothing new in cryptocurrency, with analysis from trader Sylvain Ribes previously uncovering some glaring discrepancies between the volume reported by exchanges and apparent actual liquidity as measured by slippage.
This new report builds on top of Ribes's research with an entirely different method.
Making it count
The basic method of the BTI study was to look at how many visitors of what kind each exchange gets, and how much volume they report to arrive at estimates of volume per visitor.
This is then meshed with some benchmarks gotten from the exchanges Ribes identified as honest to create a new formula. This new formula is then applied to different exchanges to look for outliers.
The following are the top ten from the report by adjusted volume:
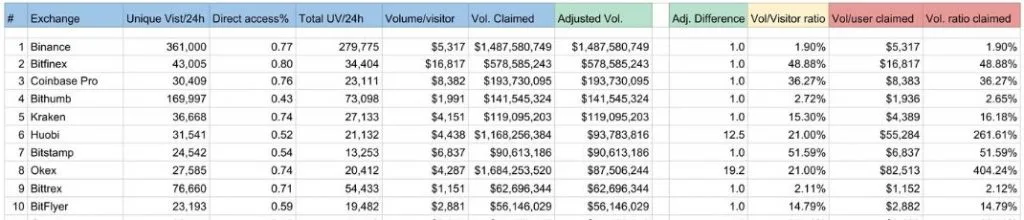
- Unique Visit/24h. This refers to the number of unique visitors who came to the site in a 24-hour period, according to BTI's research through SimilarWeb and Google Analytics.
- Direct Access%. This is the percentage of those unique visitors who arrived directly through the URL bar, rather than by clicking a referral link, a social media link or anything else. It might be thought of as the percentage of unique visitors that are regular users who actively trade on that platform.
- Total UV/24h. The total number of those regular traders who arrived directly through the URL bar.
Note that the columns seem to be arranged somewhat counter-intuitively from here on out. It's all a bit unnecessarily confusing.
- Volume/visitor. This is the apparent actual volume per visitor according to BTI's analysis. More on this below.
- Vol. Claimed. This is the volume reported by the exchanges according to CoinMarketCap.
- Adjusted Vol. The volume found by multiplying the apparent actual volume per direct access trader (total UV/24h).
Actual volume and the caveats
The actual volume, according to BTI's analysis, comes from a benchmark established by Ribes's earlier research. It picks out the exchanges that are apparently reporting their volume accurately, as most of the top ten are, and then uses them to establish a benchmark. This is why the volume claimed is such a neat match for the exact proportion of direct access visitors – because it all starts with the assumption that those exchanges are reporting volume accurately.
These benchmarks, gotten from the supposedly honest exchanges, include the average amount spent per user and average unique visitor to direct access ratio. The main caveat here is that it's only as accurate as Ribes's assumptions.
The study acknowledges that it's making some sweeping assumptions here, including that some exchanges that are known for listing a wide range of low-cap coins (it uses Cryptopia as an apt example of this kind of exchange) will naturally tend to have lower volume per user which might skew the benchmark. Conversely, an exchange that caters to high-volume institutional traders can't be expected to follow the average volume per user, the way this research assumes it will.
At the same time, these differences are broadly reflected in the data which suggests that all these assumptions are decent enough to learn something, even if the exact figures are a bit off. For example, these assumptions still give Bitfinex an unusually high volume per trader which you'd expect from a professional-style exchange with high minimums and Cryptopia a low volume per trader which you'd expect from a low-cap coin community marketplace-type exchange.
The other main condition to be aware of is that the visitor numbers themselves aren't accurate and probably don't effectively capture volume from traders that use different APIs, trading bots, certain VPNs or anything else.
The conclusions

Take it all with a grain of salt. It's probably not worth reading too much into any of the results except the most outrageous discrepancies and the tiny unknown exchanges that seem to be reporting massive volume.
The main takeaway might be that the volume for individual cryptocurrencies and the market as a whole might be skewed in unrealistic ways, and that when considering the apparent trade volumes of an individual cryptocurrency, it's worth being aware of tiny exchanges accounting for an unrealistic portion of it.
For example...
Zcash wash trading
Let's pick out one of the shadiest-looking outliers from the study. Lbank is a good option because its numbers are absolutely off the chain, and it has a history of shadiness such as trying to sell fake cryptocurrencies.
Here are its numbers by the analysis.
| Volume claimed | Volume per user claimed | Apparent actual volume | Apparent actual volume per user | Adj. Difference |
|---|---|---|---|---|
| $289,811,017 | $214,304 | $67,138 | $48 | 4,420.9 |
So according to itself, Lbank sees about US$290 million of volume per 24 hours. That's really very impressive for an exchange that gets a total of 2,885 visitors per 24-hour day, of whom only 1,385 actually go right to the site with the apparent intention of trading.
For that to be correct, each of those users would need to be moving over $200,000 of crypto per day.
Once you run it through the assumptions laid out in the study, and if you assume it should be handling like an average exchange, it's actually only doing $67,138 per day with each user moving an average of $48.
Put in somewhat mangled terms, this analysis says Lbank is either more than 4,000 times more special than a normal exchange or that it's wash trading.
At the time of writing, Lbank claims to be accounting for more than 50% of all Zcash trade according to CoinMarketCap and other sites. Specifically ZEC/ETH pairs, of all things.

This may or may not be impacting the prices directly, but it does mean that anyone looking at Zcash trading volumes today is mostly just looking at smoke and mirrors, and that most of that volume doesn't actually exist.
This kind of thing probably shouldn't be held against individual coins. As with pump and dumps, the team behind a cryptocurrency typically has nothing to do with these scammy moves even if they are benefiting from it.
The same phenomenon might be found around the markets. Even if the finer points of the BTI analysis are up for debate, there are still some takeaways to bear in mind.
Disclosure: At the time of writing, the author holds ETH, IOTA, ICX, VET, XLM, BTC and ADA.
Latest cryptocurrency news
Picture: Shutterstock
